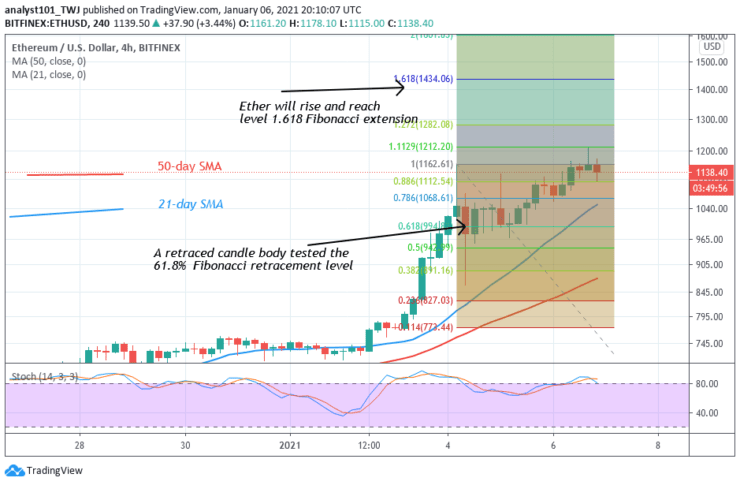
Ether has a target price of $1434.06
The crypto faces rejection at level $120
Ethereum ETH) Current Statistics
The current price: $1,182.01
Market Capitalization: $135,592,281,856
Trading Volume: $44,227,012,773
Major supply zones: $800, $820, $840
Major demand zones: $360, $340, $320
Ethereum (ETH) Price Analysis January 6, 2020
Ethereum bulls have pushed the crypto above the initial resistance at $1,100 and have rallied to $1200 high. Ether pulled back because of the resistance at the recent high. The next attempt is to break the $1,424 January 2018 historical price level. However, the upward move is facing resistance because the coin has reached the overbought region of the market. The daily stochastic and the RSI have indicated that Ether has reached the overbought region. The crypto may not have room to rally on the upside.
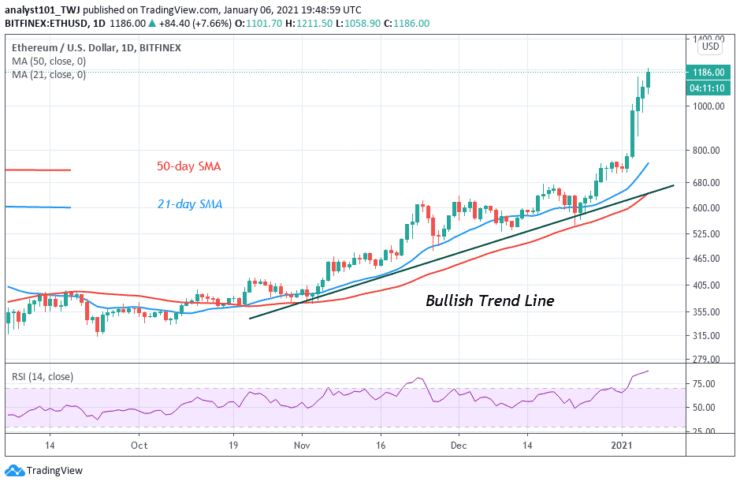
ETH Technical Indicators Reading
Ethereum is above the 80% range of the daily stochastic. The RSI is at level 88 which indicates that the crypto has no enough room to rally on the upside. The biggest altcoin is likely to correct as the crypto reaches an overbought region.
Conclusion
Ethereum has made positive moves as it targets its next price level of January 2018. On January 4 uptrend; a retraced candle body tested the 61.8% Fibonacci retracement level. It indicates that the market will rise to level 1.618Fibonacci extensions or the high of $1434.06.
Note: Learn2.Trade is not a financial advisor. Do your research before investing your funds in any financial asset or presented product or event. We are not responsible for your investing
- Broker
- Min Deposit
- Score
- Visit Broker

- Award-winning Cryptocurrency trading platform
- $100 minimum deposit,
- FCA & Cysec regulated

- 20% welcome bonus of upto $10,000
- Minimum deposit $100
- Verify your account before the bonus is credited
- Fund Moneta Markets account with a minimum of $250
- Opt in using the form to claim your 50% deposit bonus
Learn to Trade
Never Miss A Trade Again

Signal Notification
Real-time signal notifications whenever a signal is opened, closes or Updated

Get Alerts
Immediate alerts to your email and mobile phone.

Entry Price Levels
Entry price level for every signal Just choose one of our Top Brokers in the list above to get all this free.