Key Highlights
Ethereum fluctuates between $1,100 and $1,300
Ethereum slumps to $1,020 low and pulled back
Ethereum ETH) Current Statistics
The current price: $1,124.16
Market Capitalization: $127,550,407,568
Trading Volume: $43,661,698,649
Major supply zones: $1,100, $!,200, $1,300
Major demand zones: $600, $500, $400
Ethereum (ETH) Price Analysis January 11, 2020
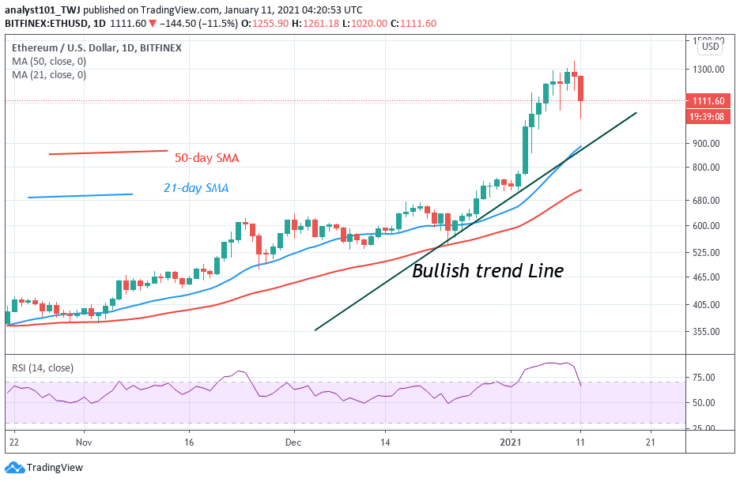
Today, Ethereum has plunged to $1,020 low and pulled back. It appears the selling pressure will persist. On the downside, if the price falls and breaks the $1,060 support, the coin will continue its fall to the $880 low. The coin has previously fallen to $1,060 low and resumed upward. Ether downward move began when the bulls failed to break the $1,300 resistance on January 9.
ETH Technical Indicators Reading
Ethereum is falling and approaching the bullish trend line. If the price breaks and closes below the trend line, it is assumed the trend has reversed. Ether is at level 65 of the Relative Strength Index. The altcoin has fallen because the coin is in the overbought region of the market. The RSI has dropped from level 89 to 65.
Conclusion
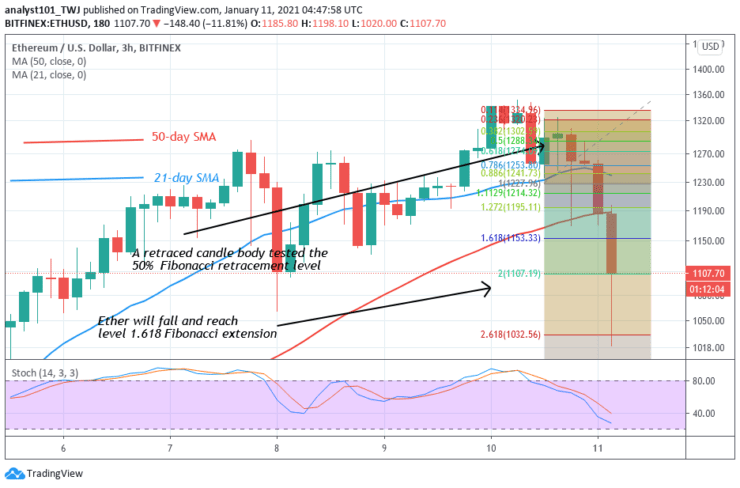
The crypto has fallen after its rejection from the recent high. The Fibonacci has indicated a further downward movement of the coin. On January 10 downtrend; a retraced candle body tested the 50%% Fibonacci retracement level. It indicates that the market will fall to level 2.0 Fibonacci extensions or the high of $1107.19.
Note: Learn2.Trade is not a financial advisor. Do your research before investing your funds in any financial asset or presented product or event. We are not responsible for your investing
- Broker
- Min Deposit
- Score
- Visit Broker

- Award-winning Cryptocurrency trading platform
- $100 minimum deposit,
- FCA & Cysec regulated

- 20% welcome bonus of upto $10,000
- Minimum deposit $100
- Verify your account before the bonus is credited
- Fund Moneta Markets account with a minimum of $250
- Opt in using the form to claim your 50% deposit bonus
Learn to Trade
Never Miss A Trade Again

Signal Notification
Real-time signal notifications whenever a signal is opened, closes or Updated

Get Alerts
Immediate alerts to your email and mobile phone.

Entry Price Levels
Entry price level for every signal Just choose one of our Top Brokers in the list above to get all this free.