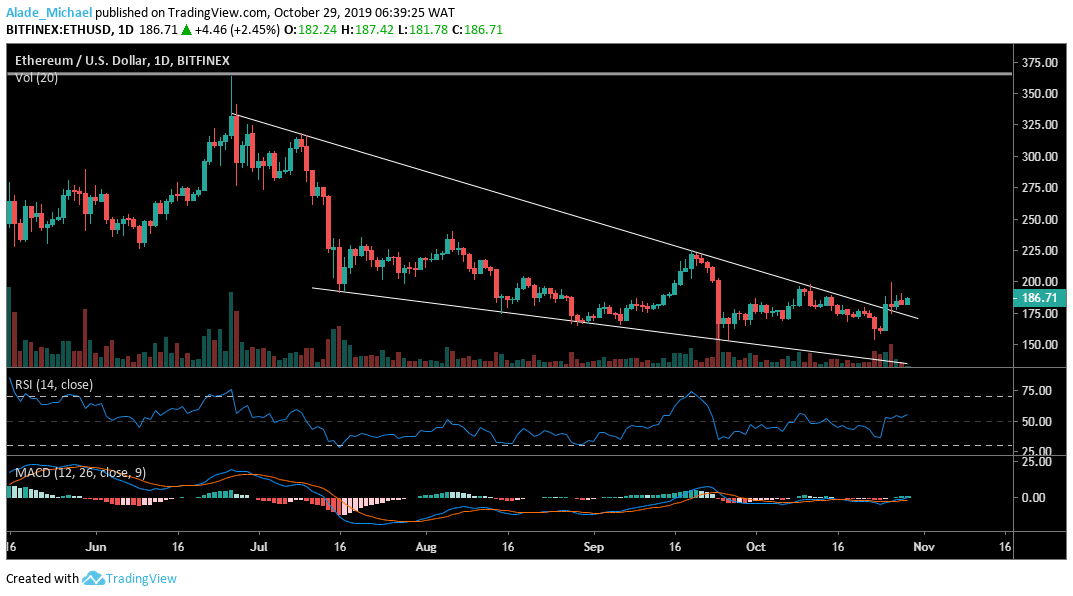
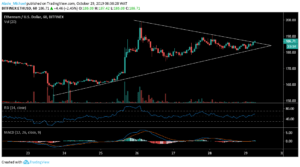
Following the last few days of the positive move, Ethereum is now trading above the 4-months descending wedge on the daily chart but the price has reached breakpoint on the hourly chart as the market carves a triangle pattern. Meanwhile, ETH is following a short-term bullish sentiment as it may become stronger in the next coming days. A weak moment may turn Ether to a severe price fall as $153 remains an important support for the market.
Ethereum (ETH) Price Analysis: Daily Chart – Neutral
Key resistance levels: $190, $199, $222
Key support levels: $174, $166, $160
On October 25, Ethereum saw a little spike above the descending wedge on the daily chart. The market has since been subdued with choppy price actions. Despite that, the ETH price has managed to rise back above the RSI 50 levels, which is an indicator for a bullish step back.

Because of this, we can look for the next resistance at around $190, $199 and $222. Meanwhile, the crypto trading signals a potential sell with a Doji candle as the bears may take charge of the market shortly.
In view of the possible move, the $174, $164 and $160 are key supports for the next selling pressure. The sideways move on the MACD shows that the market is indecisive at the moment. Ethereum may go parabolic if we continue to see a significant rise.
Ethereum (ETH) Price Analysis: Hourly Chart – Bullish
Ethereum is currently indecisive on the hourly chart as the market lurks around for a surge in volatility. Similarly, ETH is shaping inside a symmetrical triangle. The actual direction is yet unknown. But considering the current move on the technical indicators, the price of ETH is likely to fall at $175, $170, $165 and potentially $160 if the bears take over.
On the other hand, Ethereum may continue bullish momentum if the market rises above the triangle formation. Therefore, we can expect the price to hit $190, $195 and $200 in no time. Nevertheless, we can say that the Ethereum market is bullish at the moment.
ETHEREUM BUY SIGNAL
Buy Entry: $185
TP: $1195
SL: 180
- Broker
- Min Deposit
- Score
- Visit Broker
- Award-winning Cryptocurrency trading platform
- $100 minimum deposit,
- FCA & Cysec regulated
- 20% welcome bonus of upto $10,000
- Minimum deposit $100
- Verify your account before the bonus is credited
- Fund Moneta Markets account with a minimum of $250
- Opt in using the form to claim your 50% deposit bonus
Learn to Trade
Never Miss A Trade Again

Signal Notification
Real-time signal notifications whenever a signal is opened, closes or Updated

Get Alerts
Immediate alerts to your email and mobile phone.

Entry Price Levels
Entry price level for every signal Just choose one of our Top Brokers in the list above to get all this free.


