Ethereum (ETH) Price Analysis: Daily Chart – Bearish
Key resistance levels: $159, $174
Key support levels: $140, $133
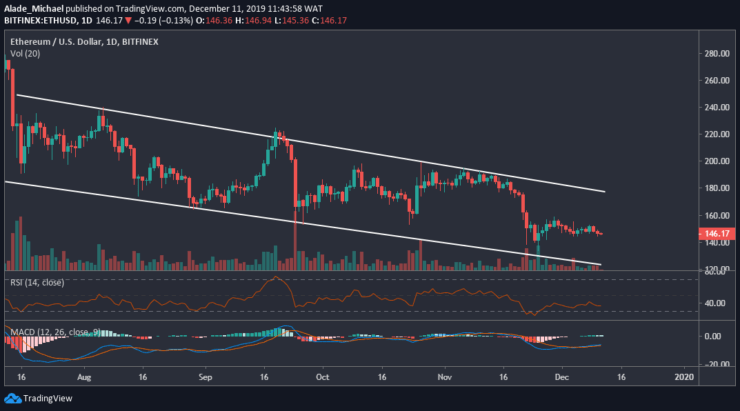
The last three weeks trading has become very rough for Ethereum, especially to surpass the $159 resistance zones. At the same time, Ethereum has been supported by the $140, although the bearish bias is still looking dominant in the daily chart. Moreover, the token has continued to remain in a descending channel pattern.

Leaving this tight price range, Ethereum would climb back to $174 if the buyers can break the $159 resistance. Inversely, Ethereum could roll back to $133 – the November low if the price drives beneath the $140 support.
Currently, ETH is trading above the RSI 30 level to show a sign of small recovery in the market. But on the MACD indicator, Ethereum remains negative but a recovery is likely if the buyers can turn active in the market.
Ethereum (ETH) Price Analysis: Hourly Chart – Bearish
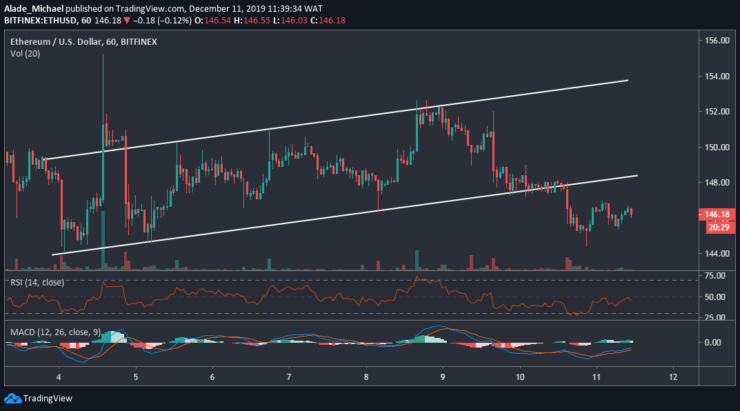
The last two days of selling has triggered a lot of pressure to the downside, bringing Ethereum out of the ascending channel that was formed since December 4. But looking at the current double-bottom pattern, it appeared there’s hope for the bulls as Ethereum may recover soon.

Meanwhile, the closest resistance for the bull is $148. A further climb would bring trading back inside the channel boundary as $150, $152 and $154 resistance could be revisited.
We can see that the RSI and the MACD indicators are slowly climbing back to reveal an incoming bullish momentum. However, if the positive signal turns false, the bears may resume pressure. Nevertheless, ETH is currently relying on $144 support.
ETHEREUM BUY SIGNAL
Buy Entry: $146
TP: $148
SL: 143.5
- Broker
- Min Deposit
- Score
- Visit Broker
- Award-winning Cryptocurrency trading platform
- $100 minimum deposit,
- FCA & Cysec regulated
- 20% welcome bonus of upto $10,000
- Minimum deposit $100
- Verify your account before the bonus is credited
- Fund Moneta Markets account with a minimum of $250
- Opt in using the form to claim your 50% deposit bonus
Learn to Trade
Never Miss A Trade Again

Signal Notification
Real-time signal notifications whenever a signal is opened, closes or Updated

Get Alerts
Immediate alerts to your email and mobile phone.

Entry Price Levels
Entry price level for every signal Just choose one of our Top Brokers in the list above to get all this free.


