Key Highlights
Ethereum faces rejection from the $2900 resistance
The biggest altcoin is likely to resume a downward move
Ethereum ETH) Current Statistics
The current price: $2,725.44
Market Capitalization : $314,627,231,432
Trading Volume: $27,332,190,526
Major supply zones: $2,800, $3,000, $3,200
Major demand zones: $1,800, $1,600, $1,400
Ethereum (ETH) Price Analysis June 6, 2021
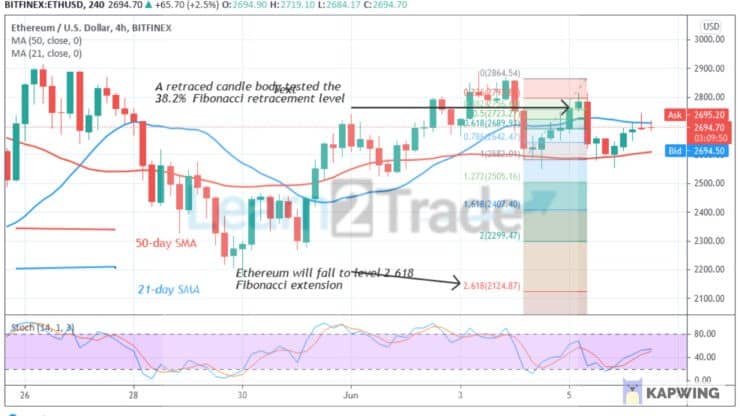
Ethereum is falling after facing rejection at the recent high of $2,700. The biggest altcoin is making series of lower highs and lower lows. The selling pressure will persist if price breaks below the moving averages. On June 4 uptrend, a retraced candle body tested the 38.2% Fibonacci retracement level. The retracement indicates that Ethereum will fall to level 2.618 Fibonacci extension or level $2,124.87.
ETH Technical Indicators Reading
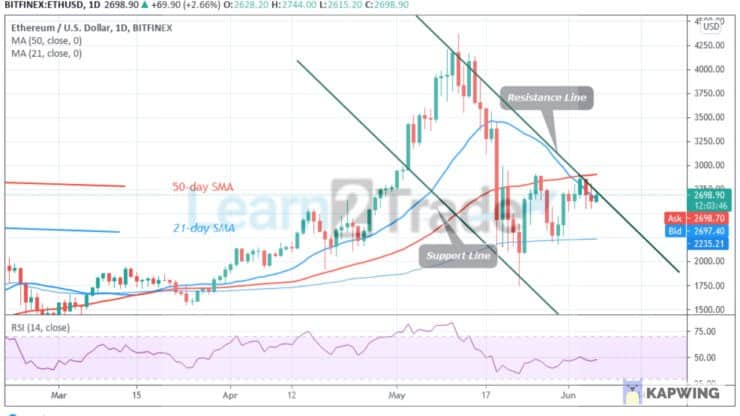
Ether is at level 47 of the Relative Strength Index period 14. It indicates that the altcoin is in the downtrend zone and below the centerline 50. The 21-day and 50-day SMAs are sloping and pointing downward indicating the downtrend. Ether is below the 40% range of daily stochastic. It indicates that the market is in a bearish momentum.
Conclusion
Ethereum is in a downward movement as it faces rejection at the $2,900. Ether price has broken the 21-day SMA and it is approaching the 50-day SMA. When the crypto’s price is below the moving averages the market will tend to fall.
You can purchase crypto coins here: Buy Coins
Note: Learn2.Trade is not a financial advisor. Do your research before investing your funds in any financial asset or presented product or event. We are not responsible for your investing results
- Broker
- Min Deposit
- Score
- Visit Broker

- Award-winning Cryptocurrency trading platform
- $100 minimum deposit,
- FCA & Cysec regulated

- 20% welcome bonus of upto $10,000
- Minimum deposit $100
- Verify your account before the bonus is credited
- Fund Moneta Markets account with a minimum of $250
- Opt in using the form to claim your 50% deposit bonus
Learn to Trade
Never Miss A Trade Again

Signal Notification
Real-time signal notifications whenever a signal is opened, closes or Updated

Get Alerts
Immediate alerts to your email and mobile phone.

Entry Price Levels
Entry price level for every signal Just choose one of our Top Brokers in the list above to get all this free.