Key Highlights
Ether fluctuates betwee $1,740 and $1,820
The biggest altcoin risks further decline to $1,640
Ethereum ETH) Current Statistics
The current price: $1,786.34
Market Capitalization: $204,930,282,284
Trading Volume: $21,676,257,238
Major supply zones: $2,000, $2,200, $2,400
Major demand zones: $1,800, $51,600, $1,400
Ethereum (ETH) Price Analysis March 17, 2021
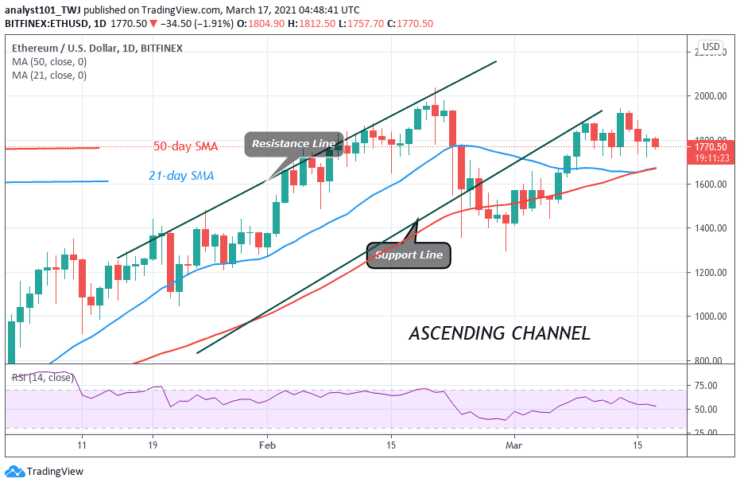
Ether has been in a downward correction for the past three days, The coin is fluctuating between $1,740 and $1,820. Today the price is falling after retesting the $1,800 resistance level. The selling pressure will increase if the bears break the current support at $1,740. That is, the biggest altcoin will further decline to $1,640. Meanwhile, Ether is trading at $1,775.80 at the time of writing.
ETH Technical Indicators Reading
The crypto’s price is falling toward the support of the moving averages. If the bears break below the SMAs, the selling pressure will resume. On the other hand, if price finds support above the SMAs, it will signal the resumption of uptrend. The coin has fallen to level 53 of the Relative Strength Index. This indicates that Ether is in the uptrend zone and above the centerline 50.
Conclusion
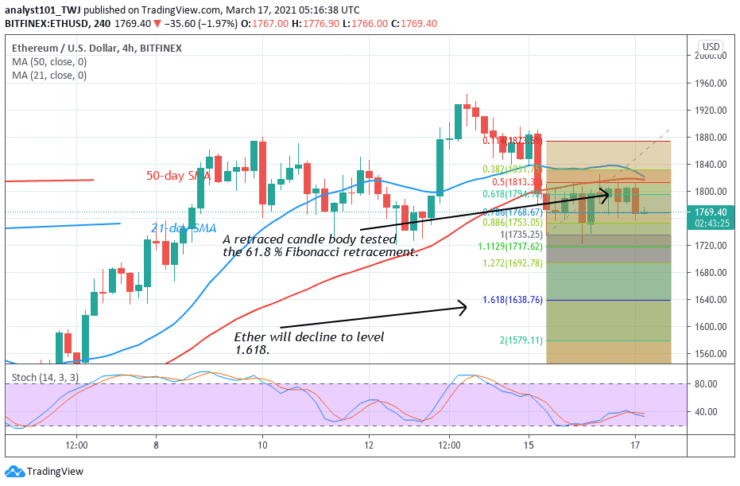
The biggest altcoin is likely to decline if the current support is breached. On March 15 downtrend; a retraced candle body tested the 61.8% Fibonacci retracement level. This retracement implies that ETH will fall to level 1.618 Fibonacci extensions or a low of $1,638.76.
You can purchase crypto coins here: Buy Coins
Note: Learn2.Trade is not a financial advisor. Do your research before investing your funds in any financial asset or presented product or event. We are not responsible for your investing results
- Broker
- Min Deposit
- Score
- Visit Broker

- Award-winning Cryptocurrency trading platform
- $100 minimum deposit,
- FCA & Cysec regulated

- 20% welcome bonus of upto $10,000
- Minimum deposit $100
- Verify your account before the bonus is credited
- Fund Moneta Markets account with a minimum of $250
- Opt in using the form to claim your 50% deposit bonus
Learn to Trade
Never Miss A Trade Again

Signal Notification
Real-time signal notifications whenever a signal is opened, closes or Updated

Get Alerts
Immediate alerts to your email and mobile phone.

Entry Price Levels
Entry price level for every signal Just choose one of our Top Brokers in the list above to get all this free.