Ethereum price rallied to $4,445 high
Ether may decline to $4,109 low
Ethereum ETH) Current Statistics
The current price: $4,249.15
Market Capitalization: $500,474,728,891
Trading Volume: $17,251,740,375
Major supply zones: $3,000, $3,500, $4,000
Major demand zones: $2,500, $2,000, $1,500
Ethereum (ETH) Price Analysis October 31, 2021
Ethereum’s (ETH) price is retracing after the recent rejection at $4,456. At first, the cryptocurrency retraced to $4,235 low and corrected upward. The upward correction was terminated at the $4,400 resistance as the bears resume downward move. Ether has fallen to the low of $4,164 and resumed upward. If the current support holds, the market will continue to rise on the upside. However, if the current support fails to hold, the downtrend will resume.
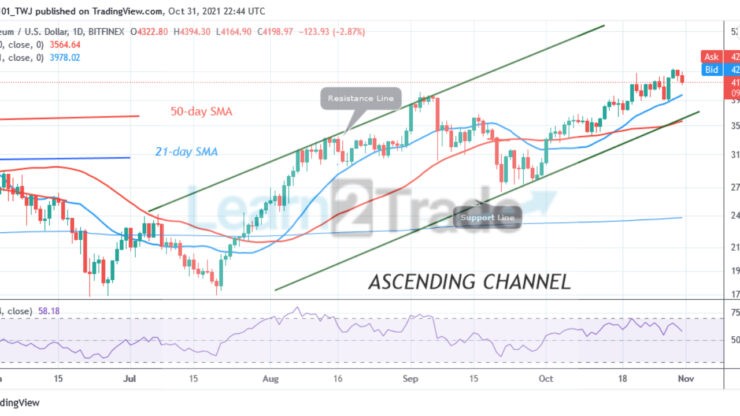
ETH Technical Indicators Reading
Ethereum is at level 59 of the Relative Strength index period 14. It indicates that the crypto is in the uptrend zone and it is above the centerline 50. Ether is above the 25% range of the daily stochastic. The market is in a bullish momentum.
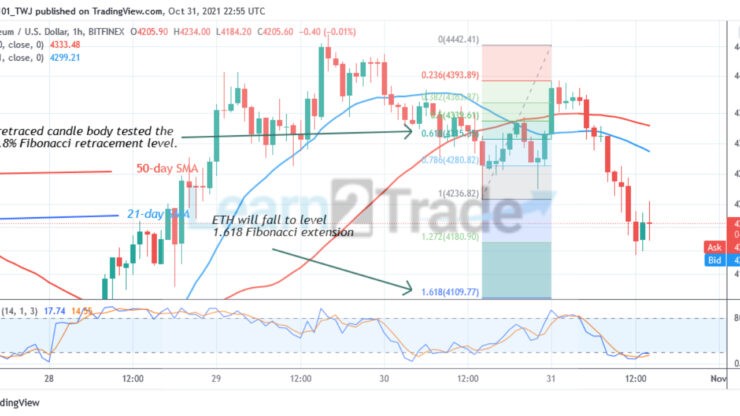
Conclusion
On the 1-hour chart, ETH/USD is in a downward move. Bullish candlesticks are indicating a possible upward move of Ether. Meanwhile, on October 30 downtrend; a retraced candle body tested the 61.8% Fibonacci retracement level. The retracement indicates that Ether will fall to level 1.618 Fibonacci extensions or level $4,109.77. From the price action, Ether has fallen to the low of $4,170 and it is resuming upward.
You can purchase crypto coins here. Buy Tokens
Note: Learn2.Trade is not a financial advisor. Do your research before investing your funds in any financial asset or presented product or event. We are not responsible for your investing
- Broker
- Min Deposit
- Score
- Visit Broker

- Award-winning Cryptocurrency trading platform
- $100 minimum deposit,
- FCA & Cysec regulated

- 20% welcome bonus of upto $10,000
- Minimum deposit $100
- Verify your account before the bonus is credited
- Fund Moneta Markets account with a minimum of $250
- Opt in using the form to claim your 50% deposit bonus
Learn to Trade
Never Miss A Trade Again

Signal Notification
Real-time signal notifications whenever a signal is opened, closes or Updated

Get Alerts
Immediate alerts to your email and mobile phone.

Entry Price Levels
Entry price level for every signal Just choose one of our Top Brokers in the list above to get all this free.