Ethereum (ETH) Price Analysis: 4H Chart – Bearish
Key resistance levels: $143, $146, $159
Key support levels: $140, $138, $133
Ethereum is following a short-term bearish scenario on the 4-hour time frame. Looking at the market sentiment, ETH value is likely to depreciate more if the price dips below $140 support that has been holding for a while now. The major target for the bears is $138 and $133 – the November low.
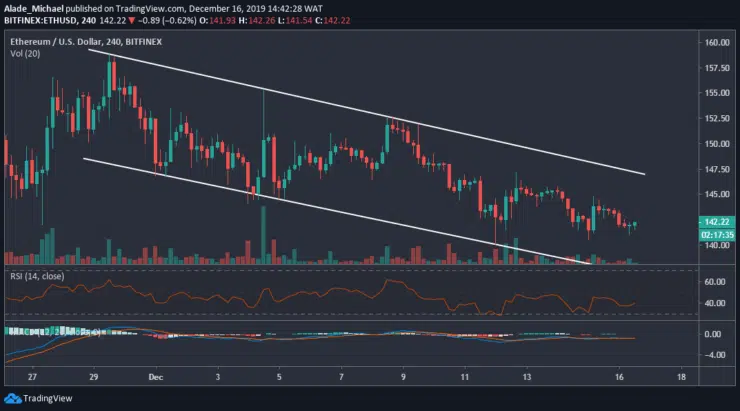
Adding to the potential decline, ETH is now trading slightly below the zero levels of the MACD to indicate that the sellers are still present. More so, the RSI is currently displaying a weak trend on the 4-hour chart indicator.
If the MACD and the RSI can turn back to the positive zone, the ETH price could increase to $143 and $146, meeting the channel’s upper boundary. A further rise could the buyers to see $159 once more. But as it stands now, the three weeks downward trend is still valid in the market. The only change to the current trend is if a bullish reversal occurs.
Ethereum (ETH) Price Analysis: Hourly Chart – Bearish
Ethereum bounced off $140 again after making a third attempt to break low. This was led by a small buying reaction which allowed ETH to now trade at $141. The recent price rejection is not enough to validate a bullish trend. In fact, the triangle pattern that is spotted on the hourly chart indicates an incoming sell-off with potential support at $138 and $136.
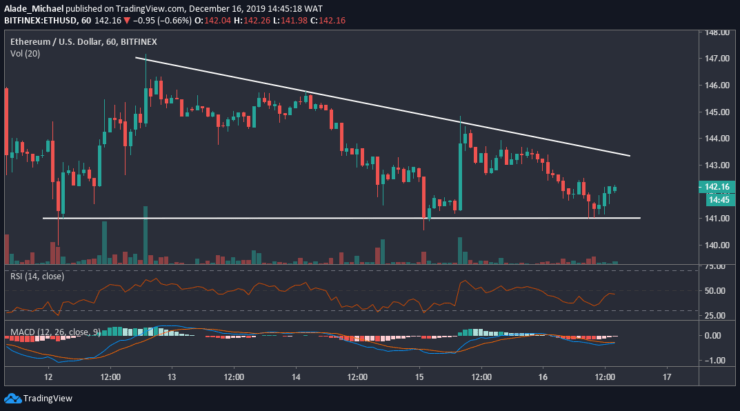
Meanwhile, an upward trend is quite uncertain as there’s no sign of a positive move at the moment. Though, there’s a close buying range at $143. The technical RSI suggests a downward trend. Similarly, the MACD is currently in a negative zone. This suggests that Ethereum remains under strong bearish control for now as more price drop is likely to play out.
ETHEREUM SELL SIGNAL
Buy Entry: $143.5
TP: $140.3
SL: 145
- Broker
- Min Deposit
- Score
- Visit Broker

- Award-winning Cryptocurrency trading platform
- $100 minimum deposit,
- FCA & Cysec regulated

- 20% welcome bonus of upto $10,000
- Minimum deposit $100
- Verify your account before the bonus is credited
- Fund Moneta Markets account with a minimum of $250
- Opt in using the form to claim your 50% deposit bonus
Learn to Trade
Never Miss A Trade Again

Signal Notification
Real-time signal notifications whenever a signal is opened, closes or Updated

Get Alerts
Immediate alerts to your email and mobile phone.

Entry Price Levels
Entry price level for every signal Just choose one of our Top Brokers in the list above to get all this free.