Ethereum (ETH) Price Analysis: Daily Chart – Bearish
Key resistance levels: $163, $177
Key support levels: $141, $131
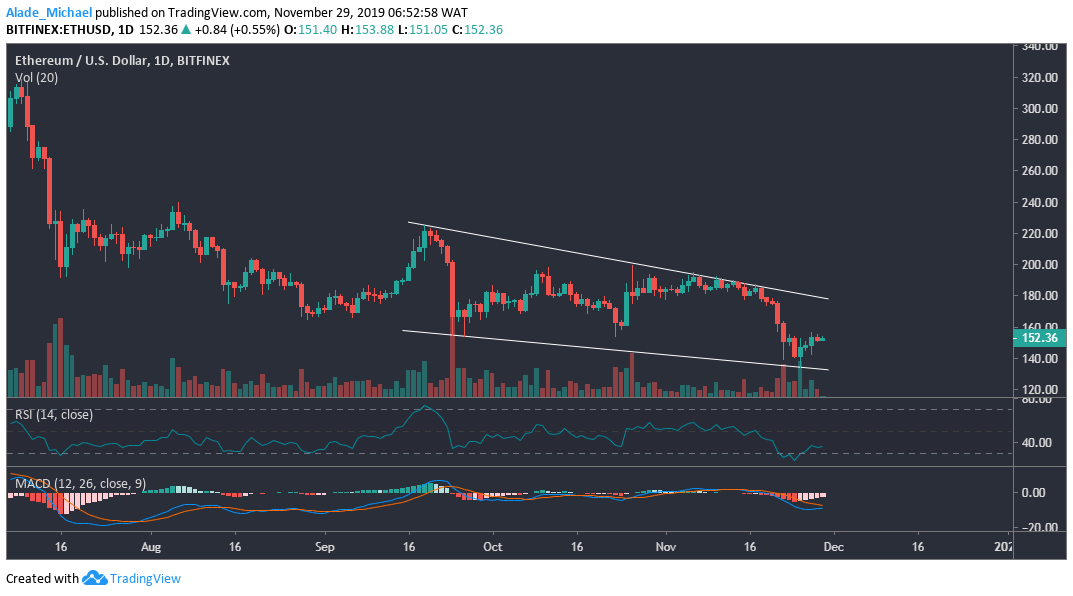
The daily outlook for Ethereum suggests a bearish trend which is now forming in a wedge pattern. Following this pattern, there’s no sign of bullish momentum for Ethereum at the moment until a wedge breakup triggers, probably at $177 resistance. Notwithstanding, the buyers are likely to meet immediate resistance at $163 if the buying pressure becomes intense.

The recent price increase gave the RSI a little rise above its 30 levels. A strong bullish regroup could continue to keep the RSI in an upward movement, making the price of ETH to reach the overbought area in no time. Currently, the MACD for Ethereum is in the bearish zone. A lower expansion of the oscillator could roll the price back to wedge’s support at $141 and $131.
Ethereum (ETH) Price Analysis: Hourly Chart – Bullish
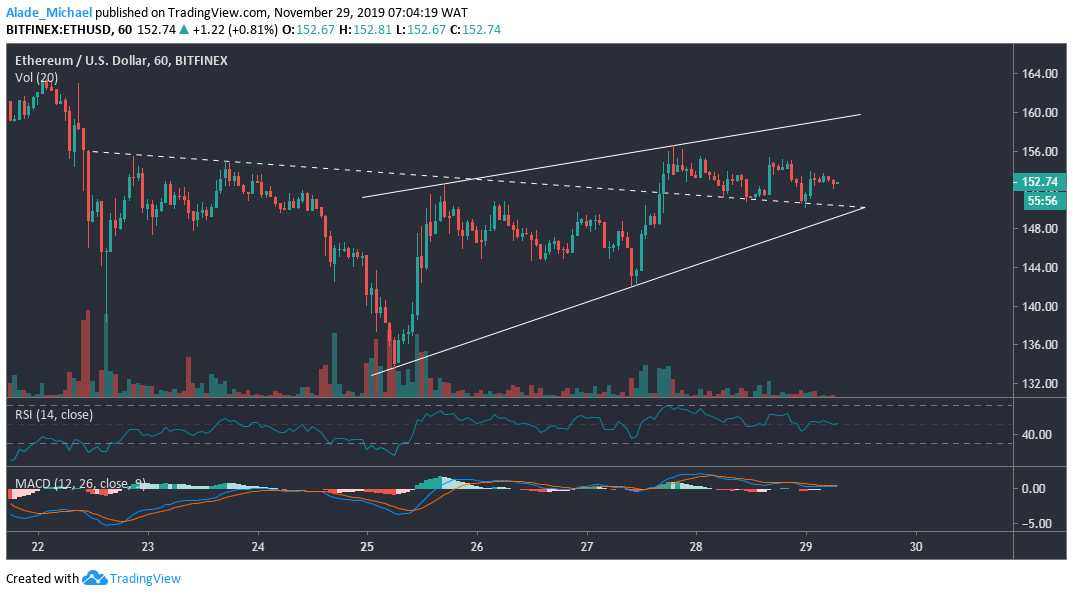
Since Ethereum broke out of the triangle pattern, the price action has been roaming on a sideways, now sitting on the broken triangle. Though, the price is now forming in a rising wedge. But it appeared the market is looking for a retest at the lower boundary of the wedge at $150 before bouncing back. A drive beneath the wedge may send ETH to near support at $141.

Bouncing off the wedge would be a perfect move and most especially an interesting experience for the bulls. The next resistance to watch out for is $156, followed by $160 – where the wedge’s upper boundary lies. We can see that Ether is currently lying at the mid-level of the technical indicators to show an indecisive market. However, we may need to wait for a while to see the actual play before taking a position.
ETHEREUM BUY SIGNAL
Buy Entry: $150.87
TP: $160
SL: 148
- Broker
- Min Deposit
- Score
- Visit Broker
- Award-winning Cryptocurrency trading platform
- $100 minimum deposit,
- FCA & Cysec regulated
- 20% welcome bonus of upto $10,000
- Minimum deposit $100
- Verify your account before the bonus is credited
- Fund Moneta Markets account with a minimum of $250
- Opt in using the form to claim your 50% deposit bonus
Learn to Trade
Never Miss A Trade Again

Signal Notification
Real-time signal notifications whenever a signal is opened, closes or Updated

Get Alerts
Immediate alerts to your email and mobile phone.

Entry Price Levels
Entry price level for every signal Just choose one of our Top Brokers in the list above to get all this free.


