Ethereum ETH) Current Statistics
The current price: $1,906.68
Market Capitalization: $229,172,175,247
Trading Volume: $6,311,653,897
Major supply zones: $3,000, $3,500, $4,000
Major demand zones: $1,700, $1,500, $1,000
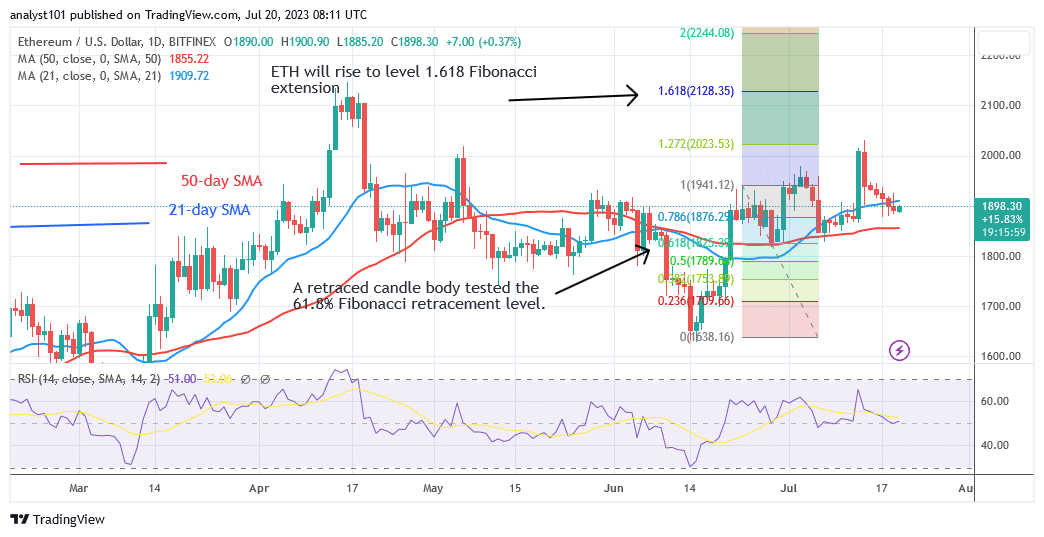
Ethereum (ETH) Price Analysis July 20, 2023
Ethereum (ETH) price is in decline, falling below the 21-day SMA as it reaches $1,827. The decrease has slowed in the area between the moving average lines. The largest altcoin is likely to be forced to trade in a range between the moving average lines.
At the time of writing, Ether had fallen to a low of $1,898.70. Selling pressure will continue till a low of $1,827 before the rising movement picks back up. The value of the coin is likely to move between the moving average lines.When the moving average lines are broken, the altcoin will trend.
For example, if the bears break below the 50-day SMA, the market will fall to a low of $1,725.
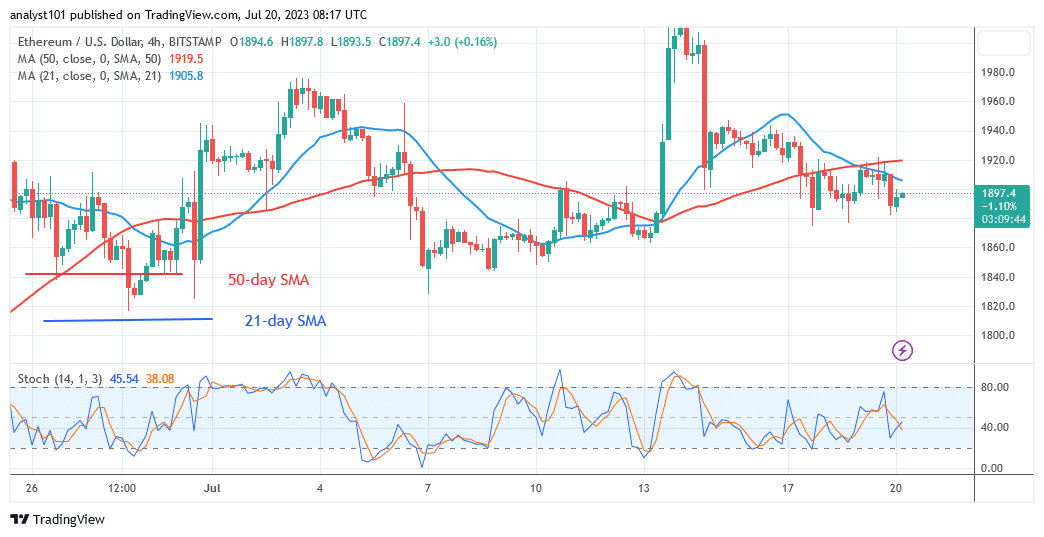
ETH Technical Indicators Reading
Ethereum has slipped below the 21-day SMA but is still trading above the 50-day SMA. This suggests that Ether will resume its sideways movement between the moving average lines for the foreseeable future.
For period 14, the altcoin is at level 51 of the Relative Strength Index. As supply and demand balance, the price of Ether has fallen to the equilibrium level. Currently, the bullish momentum has slowed above the daily Stochastic level of 40.
Conclusion
Ethereum has dropped below the moving average lines as it reaches $1,827. The most important altcoin is attempting to retest or break above the 21-day SMA. The cryptocurrency will decline and retest the 50-day simple moving average if it faces rejection at the recent high.
If the price breaks above the 21-day simple moving average, the bullish trend will restart. The altcoin will increase and re-visit the psychological price level of $2,000 shortly.
You can purchase crypto coins here. Buy LBLOCK
Note: Learn2.Trade is not a financial advisor. Do your research before investing your funds in any financial asset or presented product or event. We are not responsible for your investing .
- Broker
- Min Deposit
- Score
- Visit Broker

- Award-winning Cryptocurrency trading platform
- $100 minimum deposit,
- FCA & Cysec regulated

- 20% welcome bonus of upto $10,000
- Minimum deposit $100
- Verify your account before the bonus is credited
- Fund Moneta Markets account with a minimum of $250
- Opt in using the form to claim your 50% deposit bonus
Learn to Trade
Never Miss A Trade Again

Signal Notification
Real-time signal notifications whenever a signal is opened, closes or Updated

Get Alerts
Immediate alerts to your email and mobile phone.

Entry Price Levels
Entry price level for every signal Just choose one of our Top Brokers in the list above to get all this free.