Ethereum (ETH) Current Statistics
The current price: $2,568.00
Market Capitalization: $308.63B
Trading Volume: $11.99B
Major supply zones: $3,000, $3,500, $4,000
Major demand zones: $1,700, $1,500, $1,000
Ethereum (ETH) Price Analysis January 14, 2024
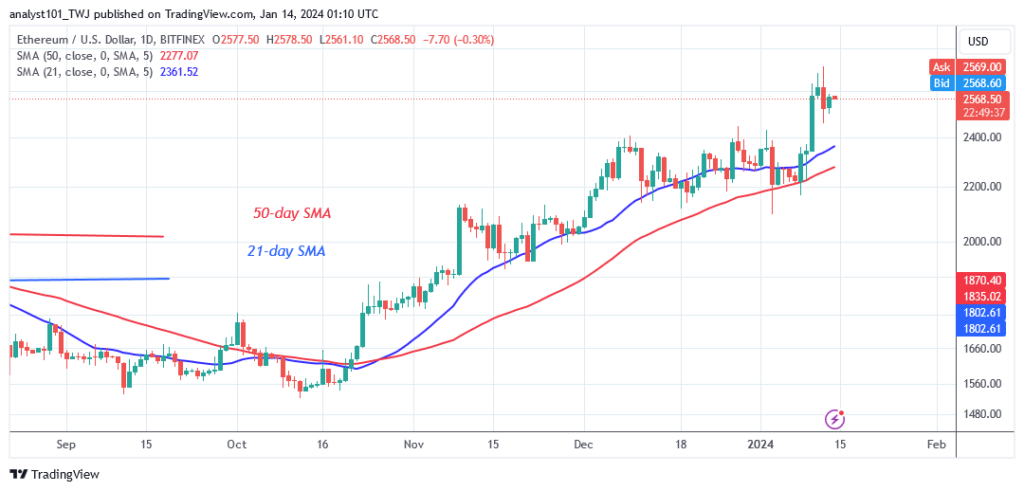
Ethereum’s (ETH) price has twice challenged the resistance level as it halts at $2,700. Ether is now trading near its previous high of $2,700. As it approaches the most recent high, the upward trend comes to a halt above the current support.
Buyers want the bullish trend to continue as long as it is in the positive trend zone. The market will rise above the barrier level at $2,700 provided the present positive momentum is maintained. The positive trend will continue to the $3000 peak. ETH/USD is currently trading just above the $2,500 support level.
ETH Technical Indicators Reading
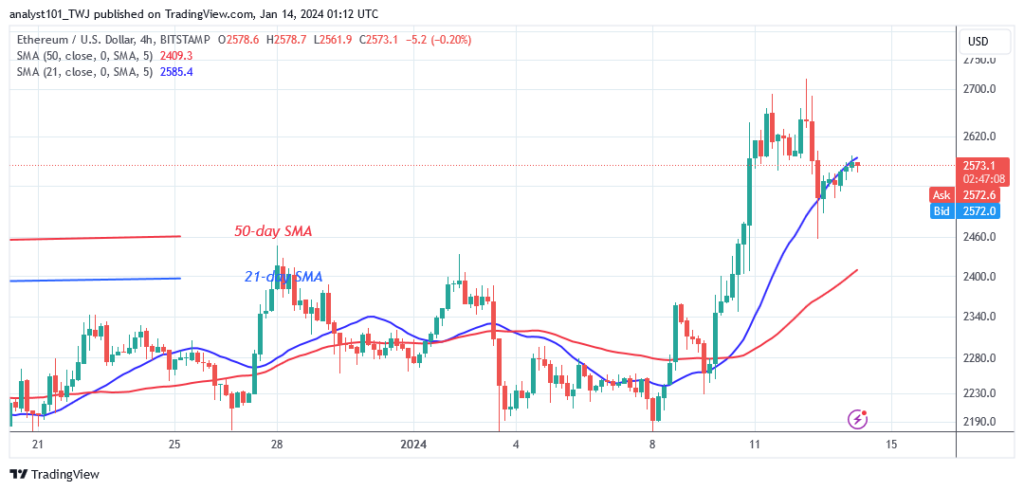
Ether price bars are above the moving average lines as it halts at $2,700. The upward trend is seen by the moving average lines heading north. Doji candlesticks describe the price behavior of the altcoin. The market’s overbought area is where the largest altcoin is now trading.
Conclusion
ETH/USD is currently trading in a close range, above the current support level of $2,500 but below the resistance level of $2,700. Doji candlesticks show how the price action is moving on the 4-hour chart. These candlesticks have an impact on the coin’s ability to rise or fall.
You can purchase crypto coins here. Buy LBLOCK
Note: Learn2.Trade is not a financial advisor. Do your research before investing your funds in any financial asset or presented product or event. We are not responsible for your investing
- Broker
- Min Deposit
- Score
- Visit Broker

- Award-winning Cryptocurrency trading platform
- $100 minimum deposit,
- FCA & Cysec regulated

- 20% welcome bonus of upto $10,000
- Minimum deposit $100
- Verify your account before the bonus is credited
- Fund Moneta Markets account with a minimum of $250
- Opt in using the form to claim your 50% deposit bonus
Learn to Trade
Never Miss A Trade Again

Signal Notification
Real-time signal notifications whenever a signal is opened, closes or Updated

Get Alerts
Immediate alerts to your email and mobile phone.

Entry Price Levels
Entry price level for every signal Just choose one of our Top Brokers in the list above to get all this free.