Ether holds above $3,000
Ether is confined in a range
Ethereum ETH) Current Statistics
The current price: $3,071.09
Market Capitalization: $369,938,407,419
Trading Volume: $15,556,770,494
Major supply zones: $4,000, $4,500, $5,000
Major demand zones: $3,500, $3,000, $2,500
Ethereum (ETH) Price Analysis April 20, 2022
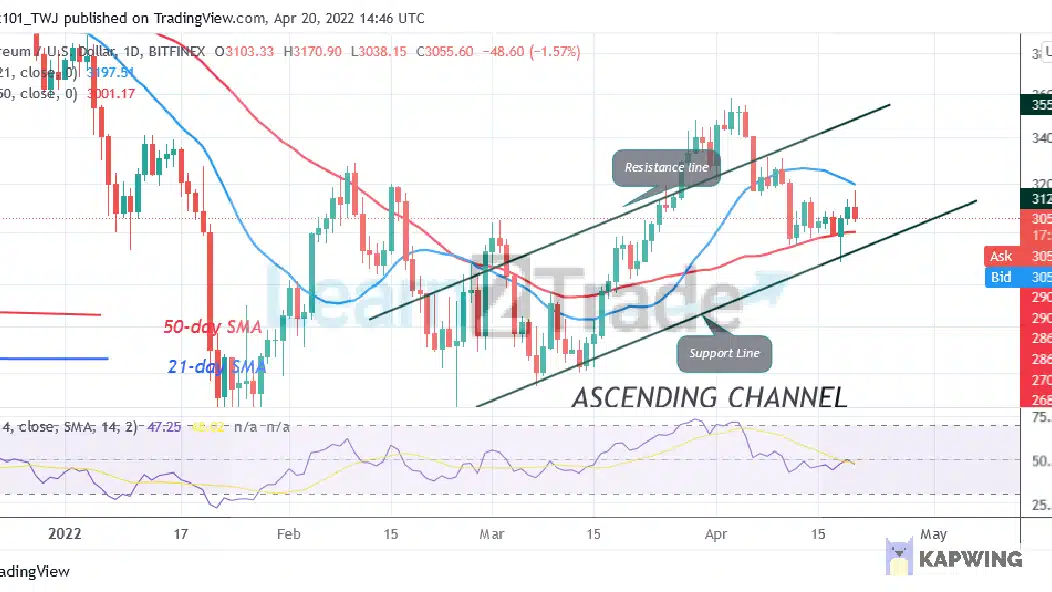
Ethereum’s (ETH) price is still in a downward correction as prices reach equilibrium. The price movement has remained the same. For the past week, Ether’s price has been fluctuating between $3,000 and $3,200 price levels. In other words, the market is confined between the 50-day line SMA and the 21-day line SMA. The largest altcoin will trend when the moving average lines are broken. Today, Ether is trading at $3,053 at the time of witting. Presently, the altcoin is falling to the support above the 50-day line SMA. The selling pressure will resume if the bears break below the 50-day line SMA.
ETH Technical Indicators Reading
The largest altcoin is at level 47 of the Relative Strength Index for period 14. The market is in the downtrend zone and below the centerline 50. This implies that Ether is likely to decline. The crypto’s price bars are between the moving averages indicating a possible range bound move of the cryptocurrency. For the past week, the crypto has been fluctuating between the moving averages. The altcoin is below the 40% range of the daily stochastic. The market is in a bearish momentum.
Conclusion
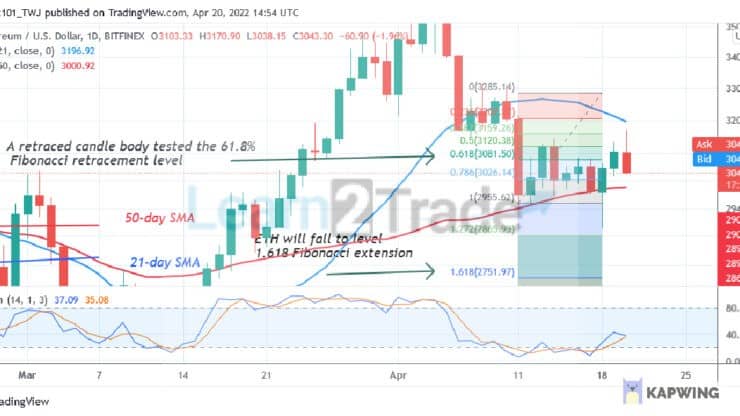
Ethereum is in a downward move as prices reach equilibrium. The crypto fell and resumed a range-bound move in a confined range. Meanwhile, on April 11 downtrend; a retraced candle body tested the 61.8% Fibonacci retracement level. The retracement indicates that ETH will fall to level 1.618 Fibonacci extension or $2,751.97.
You can purchase crypto coins here. Buy LBlock:
Note: Learn2.Trade is not a financial advisor. Do your research before investing your funds in any financial asset or presented product or event. We are not responsible for your investing
- Broker
- Min Deposit
- Score
- Visit Broker

- Award-winning Cryptocurrency trading platform
- $100 minimum deposit,
- FCA & Cysec regulated

- 20% welcome bonus of upto $10,000
- Minimum deposit $100
- Verify your account before the bonus is credited
- Fund Moneta Markets account with a minimum of $250
- Opt in using the form to claim your 50% deposit bonus
Learn to Trade
Never Miss A Trade Again

Signal Notification
Real-time signal notifications whenever a signal is opened, closes or Updated

Get Alerts
Immediate alerts to your email and mobile phone.

Entry Price Levels
Entry price level for every signal Just choose one of our Top Brokers in the list above to get all this free.