
Price Analysis – October 08
Should the bears have enough momentum to break down the support level of $2.3, then, the price will be exposed to $2.2 and $1.7 demand level. In case the bulls prevail over the bears, the resistance level of $2.7 will be penetrated and the price will increase to $2.9 and $3.3 resistance levels.
Key Levels:
Resistance levels: $2.7, $2.9, $3.3
Support levels: $2.3, $2.2, $1.7
EOS/USD Long-term Trend: Ranging
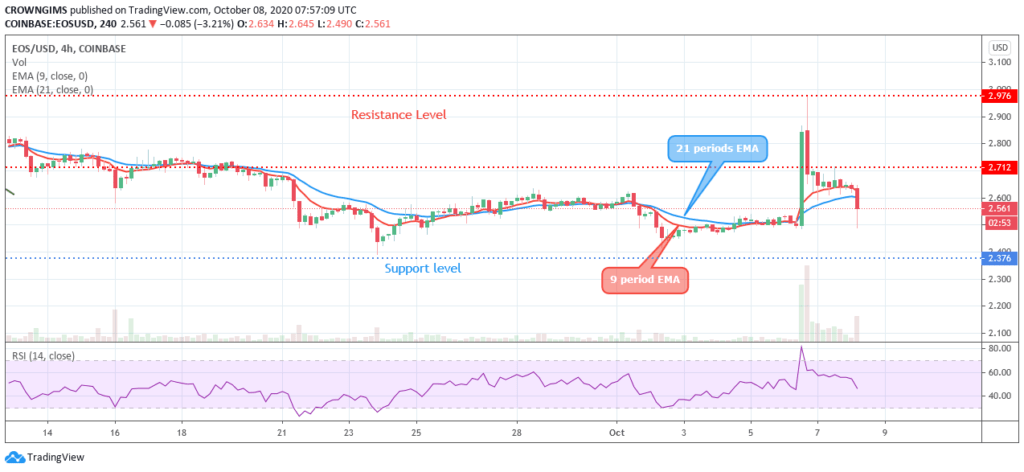
EOSUSD is bearish in the long-term outlook. The Crypto found support at $2.3 on September 24. The sellers could not break through the support level at $2.3, the price pulled back to retest the resistance level of $2.7 but the dynamic resistance levels prevented the move. The confluence at the region prevents the bulls to break up the $2.7 level. The scenario leads to a ranging movement within the $2.7 and $2.3 levels.

At the moment, the price is decreasing towards the support level of $2.3. The price is crossing the 9 periods EMA and 21 periods EMA downside. Should the bears have enough momentum to break down the support level of $2.3, then, the price will be exposed to $2.2 and $1.7 demand level. In case the bulls prevail over the bears, the resistance level of $2.7 will be penetrated and the price will increase to $2.9 and $3.3 resistance levels. There is a tendency for the price to test the demand level of $2.3 as the relative strength index period 14 is bending down below 50 levels which indicates a sell signal.
EOS/USD Price Medium-term Trend: Bearish
There was a price spark in the EOS market on October 06. The bulls increase suddenly from $2.3 to $2.9 resistance level with the formation of a big bullish candle. The price bounces off the resistance level and currently declining towards $2.3 price level.

The 9 periods EMA is trying to cross the 21 periods EMA and the price is trading below the two dynamic resistance levels which indicate an increase in the bears’ pressure. The price may decline further.


