Don’t invest unless you’re prepared to lose all the money you invest. This is a high-risk investment and you are unlikely to be protected if something goes wrong. Take 2 minutes to learn more
EIGENLAYER Price Forecast—October 28th
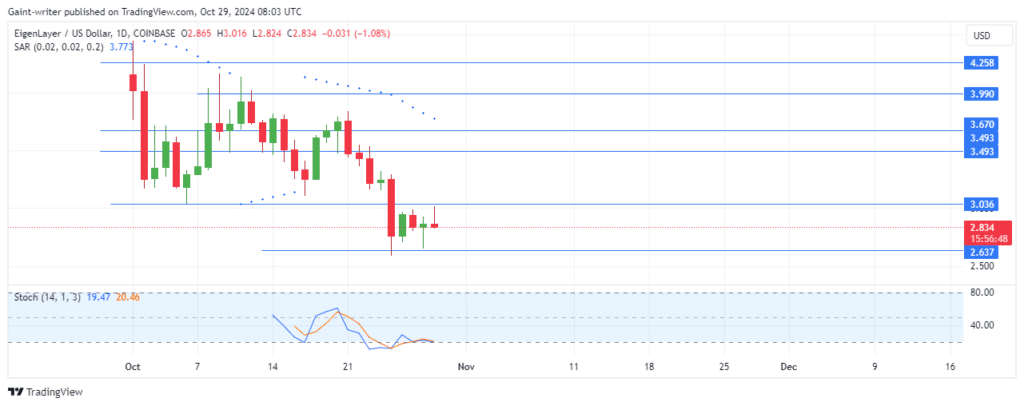
The EigenLayer price forecast shows the market has drifted lower as sellers maintain a firm hold on the market.
EIGENUSD Long-Term Trend: Bearish (Daily Chart)
Key Levels
Support Levels: $2.670, $2.500
Resistance Levels: $3.030, $3.600
EigenLayer Price Forecast: EIGENUSD Outlook
The intensified sell-off indicates a solid bearish grip, signaling further downside potential as sellers push for a fresh plunge. The Parabolic SAR Stop and Reverse indicator trends lower, highlighting the selling pressure around the current market area. Additionally, the Stochastic Oscillator remains in the sell zone, further supporting the bearish outlook as momentum holds in sellers’ favor.
If sellers maintain control, they could drive the EigenLayer price toward the $2.500 support level. This target may serve as the next critical point for buyers to attempt a reversal, though continued pressure could further suppress bullish attempts. In contrast, if buyers find support near the $2.670 level, a consolidation phase may begin before any significant breakout attempt.
The current technical setup favors the sellers, who are well-positioned to extend the downtrend if bearish momentum continues. The EIGENUSD market’s structure suggests that buyers will need to demonstrate stronger commitment to shift the trend back up, especially if they hope to reclaim the $3.030 level.
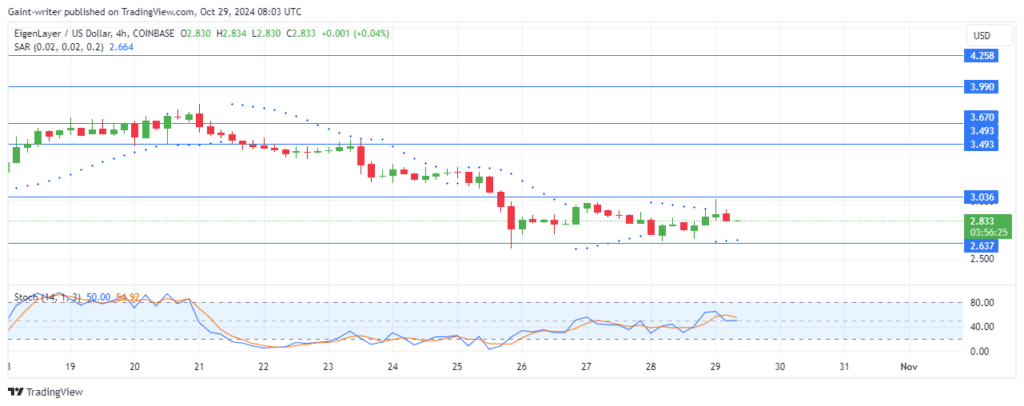
EIGENUSD Medium-Term Trend: Bearish (4-Hour Chart)
In the 4-hour chart, the market is consolidating, yet sellers are attempting to keep prices under pressure. The Stochastic Oscillator has recently crossed lower, reaffirming seller control, though the Parabolic SAR currently shows a lack of decisive focus.
Make money without lifting your fingers: Start using a world-class auto trading solution
How To Buy Lucky Block – Guide, Tips & Insights | Learn 2 Trade
Note: Learn2.trade is not a financial advisor. Do your research before investing your funds in any financial asset, product, or event. We are not responsible for your investment results.
- Broker
- Min Deposit
- Score
- Visit Broker
- Award-winning Cryptocurrency trading platform
- $100 minimum deposit,
- FCA & Cysec regulated
- 20% welcome bonus of upto $10,000
- Minimum deposit $100
- Verify your account before the bonus is credited
- Fund Moneta Markets account with a minimum of $250
- Opt in using the form to claim your 50% deposit bonus
Learn to Trade
Never Miss A Trade Again

Signal Notification
Real-time signal notifications whenever a signal is opened, closes or Updated

Get Alerts
Immediate alerts to your email and mobile phone.

Entry Price Levels
Entry price level for every signal Just choose one of our Top Brokers in the list above to get all this free.


