EigenLayer price forecast shows the market is facing significant selling pressure, with buyers struggling to initiate a sustained recovery from the $1.000 significant level.
EIGENUSD Key Levels:
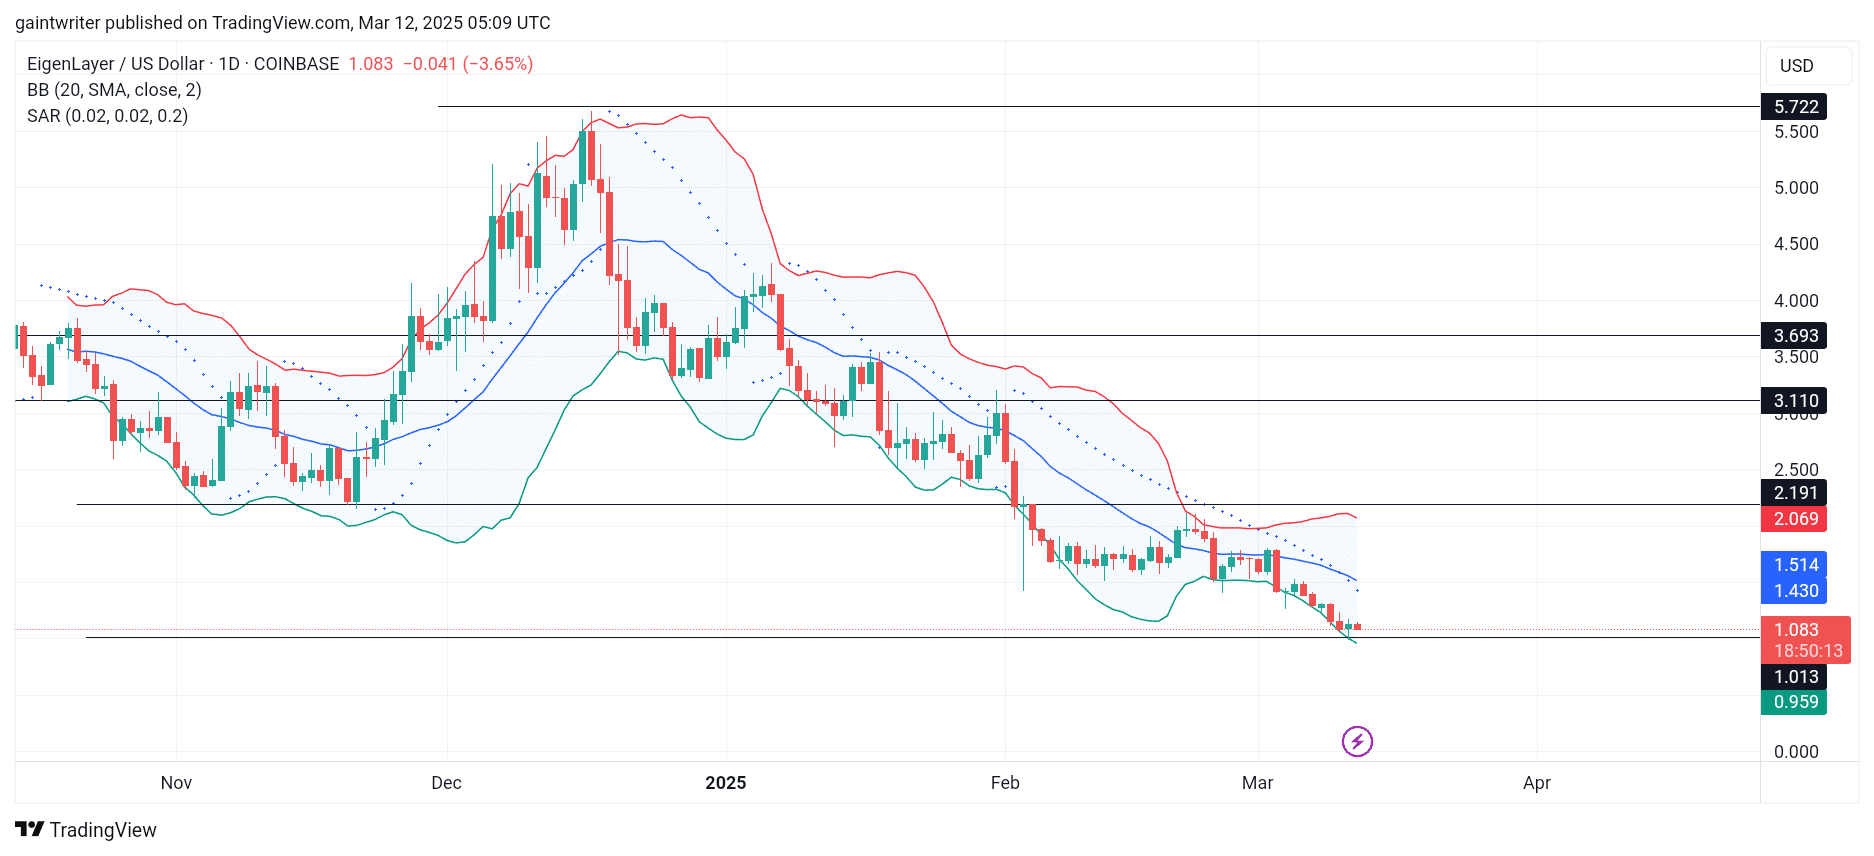
Support Levels: $1.000, $1.500 Resistance Levels: $2.000, $3.000
EigenLayer Long-Term Trend: Bearish (Daily Chart)
The first quarter of the year has been marked by persistent selling pressure on EigenLayer. In February, buyers failed to break through the $3.000 resistance, leading to a sharp decline to $1.500. A subsequent recovery to $2.000 was short-lived. In March, sellers intensified their pressure, pushing the price down to the $1.000 support level. This confirms a strong bearish trend.
EigenLayer Price Forecast – EIGENUSD Outlook
The Bollinger Bands’ expansion indicates high volatility, reinforcing the strength of the current downtrend. The Parabolic SAR (Stop and Reverse) indicator confirms that sellers remain in control, with the dots positioned above the price action.
As sellers continue to gain ground, it will be harder for buyers to find penetration in the market. On the daily chart, as the buyers try to reclaim strength, the market is currently consolidating. This shows that it might take a while for the buyers to adjust in the market.
The current market dynamic suggests that sellers are maintaining their dominance. The high volatility indicated by the Bollinger Bands suggests that further price fluctuations are likely. The Parabolic SAR’s continued bearish signal indicates a lack of buying momentum. Traders should closely monitor the $1.000 support level, as a break below this level could lead to further significant declines.
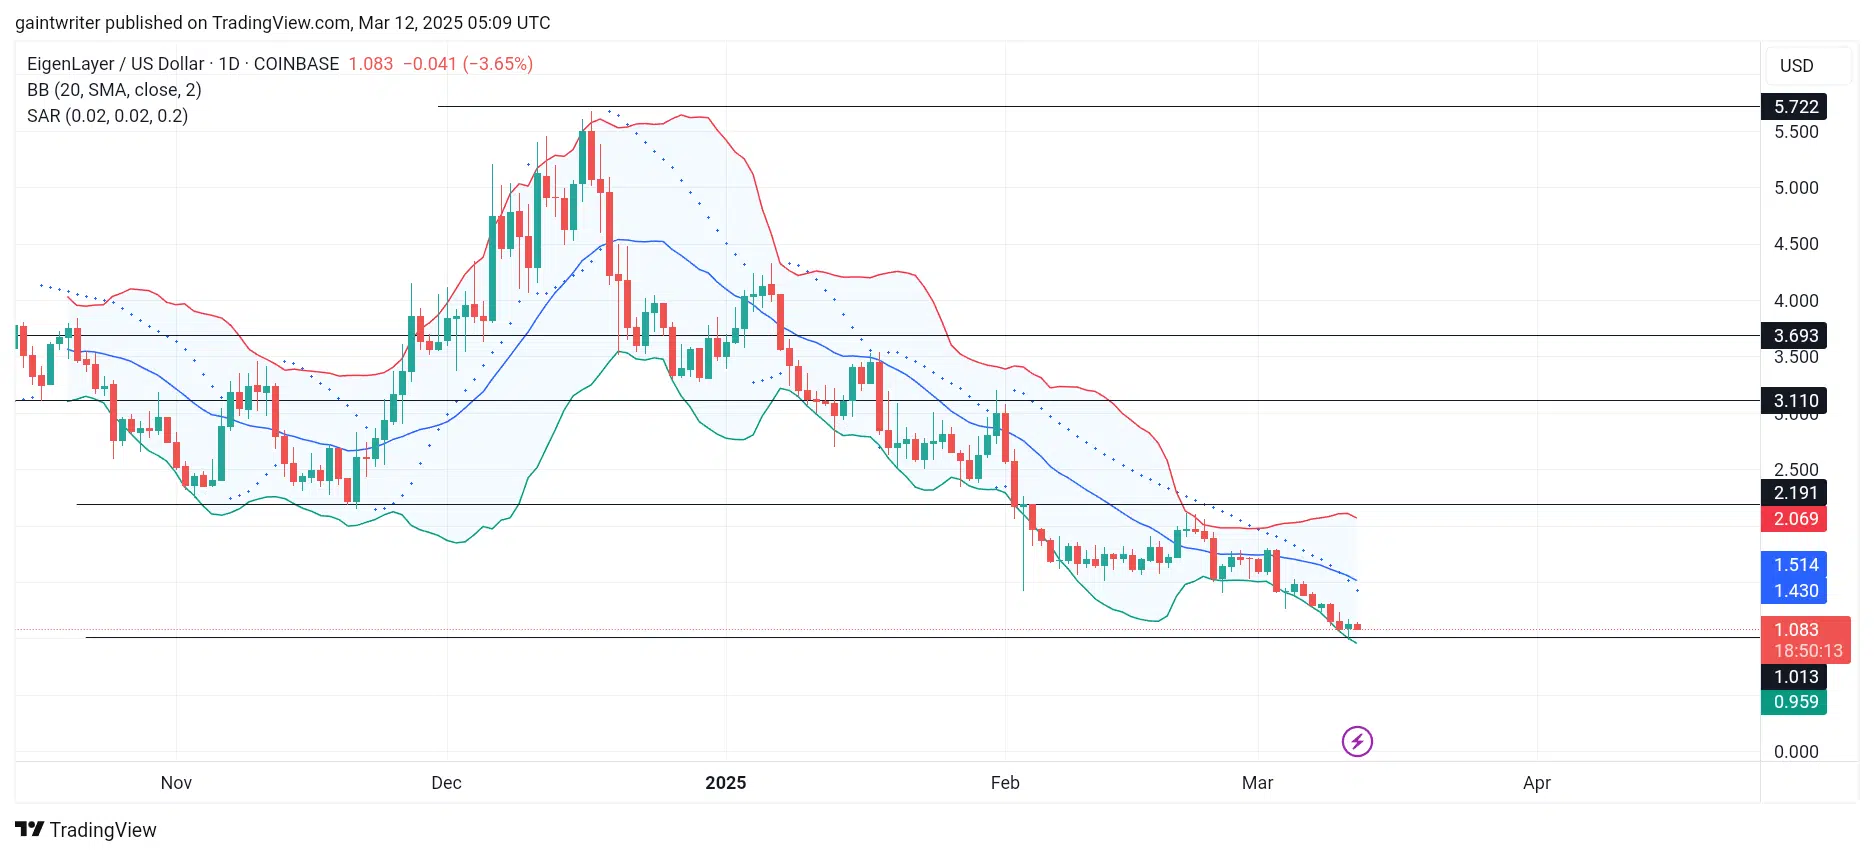
EigenLayer Medium Term Trend: Bearish (4-hour chart)
The short-term timeframe continues to reflect a bearish market structure. The Bollinger Bands indicate ongoing volatility, with the potential for further price swings. While a reversal is possible, the current technical indicators suggest that sellers are likely to maintain control in the near term. Traders should remain vigilant for any signs of a potential reversal, such as a bullish divergence in the RSI or a bullish crossover in the MACD, but until those signals appear, the trend is down.
Note: Learn2.trade is not a financial advisor. Do your research before investing your funds in any financial asset, product, or event. We are not responsible for your investment results.
Trade on MT4 with Leverage up to 1:500! Trade on MT4 with Leverage up to 1:500!
X
We use cookies to ensure that we give you the best experience on our website. If you continue to use this site we will assume that you are happy with it.
 EigenLayer Medium Term Trend: Bearish (4-hour chart)
 EigenLayer Medium Term Trend: Bearish (4-hour chart)


