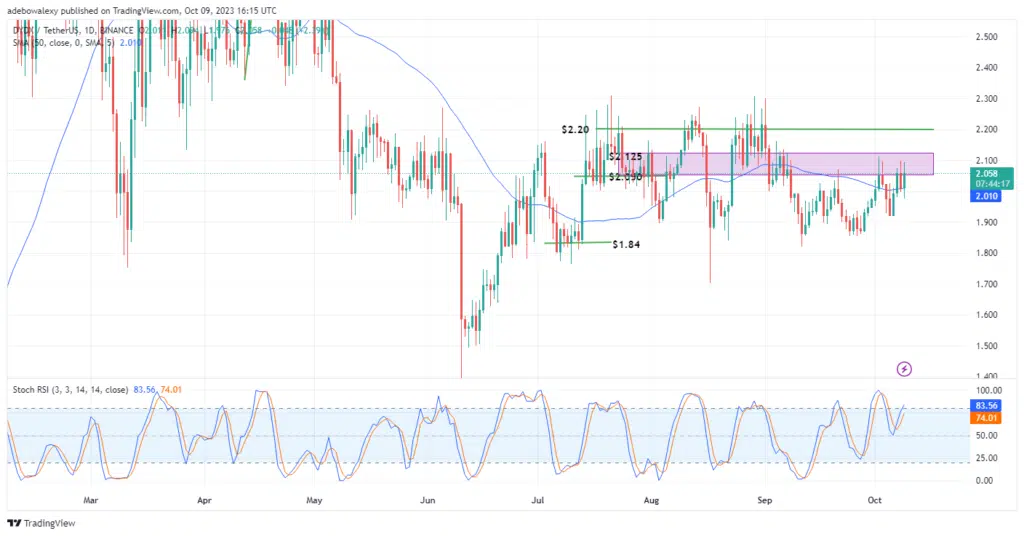
DYDXUSDT price has seen some upside price movements today. Despite that, headwinds in the market have exerted some pressure on price action, causing it to regress. As a result, bulls in this market are sitting on a defensive line while trying to hold on to acquired gains.
DYDX Statistics:
DYDX Value Now: $2.058
DYDX Market Cap: $376,294,964
DYDX Circulating Supply: 183,765,523
DYDX Total Supply: 1,000,000,000
DYDX CoinMarketCap Ranking: 81
Major Price Levels:
Top: $2.058, $2.100, and $2.150
Base: $2.050, $2.000, and $1.950
DYDXUSDT Buyers Take a Defensive Position
Headwinds in the DYDXUSDT daily market have forced buyers to fall back to a stronghold atop the 50-day Moving Average (MA) line. Nevertheless, the ongoing session continues to stand in favor of bulls, despite the downward correction incurred. The price candle representing the ongoing session can be seen sitting on the 50-day MA line.
Likewise, the Relative Strength Index (RSI) indicator lines can be seen still rising further into the overbought region. At this point, the leading line of this indicator has risen above the 80 mark, while the lagging one follows closely behind at the 73 mark. Consequently, this suggests that upside momentum still has some room to grow a bit, pushing prices further.

dYdX Maintains Gaze on the Upside Despite Minimal Correction in the Ongoing Session
Also, the curves of this indicator show that the upside momentum may still have some room to develop, as it is still below the 50 level of the indicator. Meanwhile, trading activities keep occurring at considerable distances above the MA line. Therefore, traders can still project that prices may rise towards the $2.125 price mark.