Don’t invest unless you’re prepared to lose all the money you invest. This is a high-risk investment and you are unlikely to be protected if something goes wrong. Take 2 minutes to learn more
Shortly after the price action in the DYDX/USDT market broke the support level constituted by the Fibonacci Retracement level of 78.60, it almost immediately started challenging as a resistance. Buyers in this market seem to have besieged the token price at this level. Consequently, this seems to be the reason why prices seem to have started to retrace their way upwards.
DYDX Statistics
DYDX Value Now: $1.596
dydx Market Cap: $248M
DYDX Moving Supply: 156,256,174
dydx Total Supply: 1,000,000,000
DYDX CoinMarketCap Ranking: 107
Major Price Levels:
Top: $1.596, $1.640, and $1.700
Base: $1.556, $1.500, and $1.450
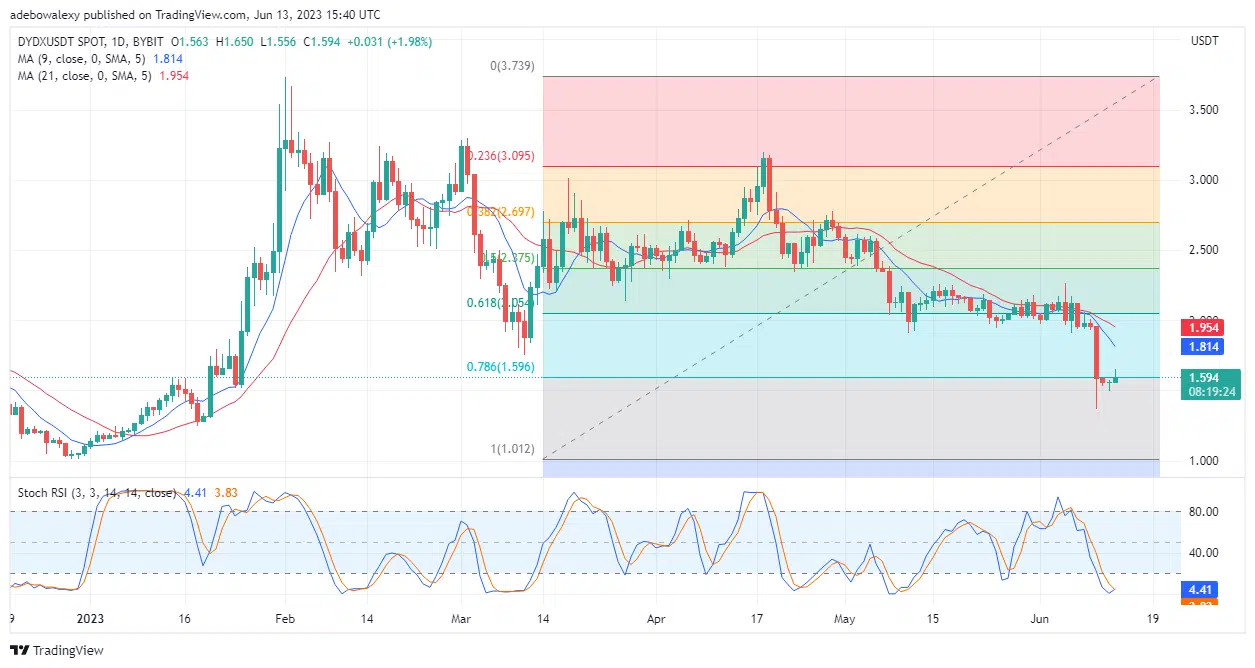
DYDX/USDT Price Action Prepares to Break the Resistance at $1.596
Over the past two trading sessions, the prevalent price downtrend in the crypto market seems to have been effectively abated. This is based on the fact that green price candles have started showing up on the DYDX/USDT daily market chart, which has caused some minimal upside price retracement. At this point, the last price candle here has brought prices to the same level as the Fibonacci retracement level at $1.596. However, price action remains significantly below the 9- and 21-day Moving Average curves. Meanwhile, the Relative Strength Index (RSI) lines are the initial stage of an upside crossover in the oversold region. Consequently, this indicates that an upside retracement may occur in this market but may remain in the regions below the MA line in the meantime.
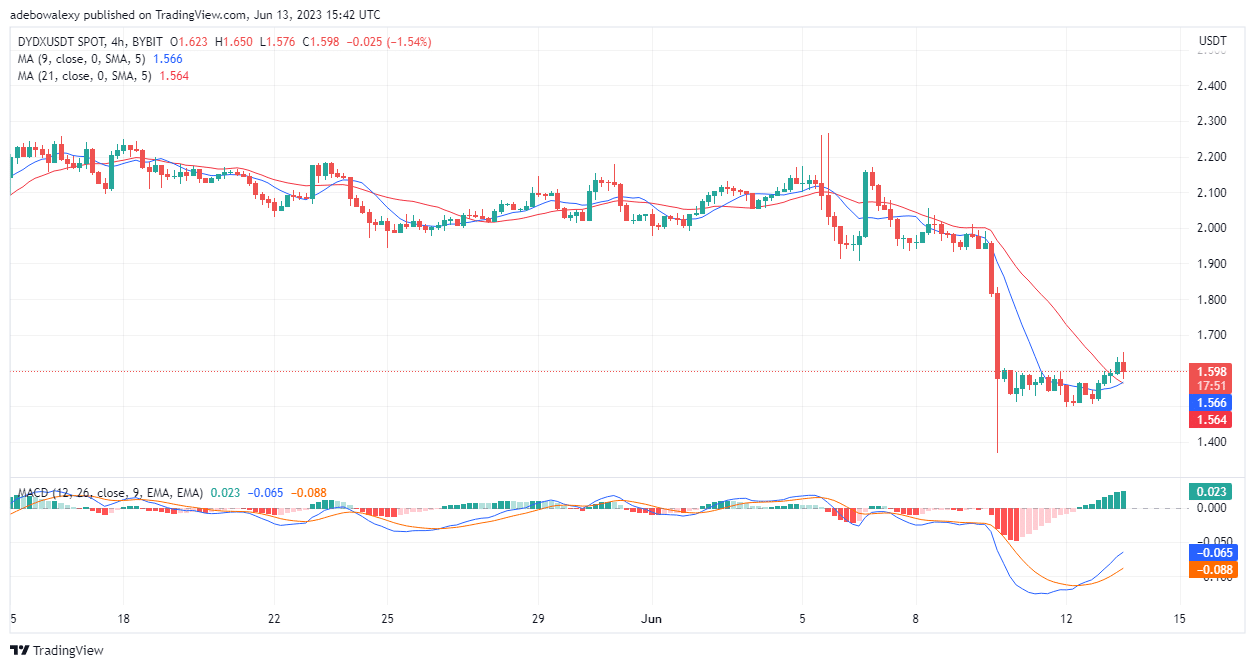
DYDX/USDT Price Action: Upside Retracement Stays on Course
Moving on to the DYDX/USDT 4-hour market, we can see that the spotted upside retracement is determined to continue, despite presented setbacks by short traders. Technical indicators are in support of a possible further upside retracement in this market. The last two price candles for this market have remained above the converged 9- and 21-day MA curves. This suggests that a more bullish impetus may be delivered to this market due to the impending crossover in the MA lines. At the same time, the Moving Average Convergence Divergence (MACD) indicator lines have continued trending upwards following a bullish crossover. Also, the appearance of the last bullish price candle seems not to have resulted in any signs of weakening momentum on the MACD indicator. Therefore, it can still be concluded that price action may retrace the $1.80 mark.
- Broker
- Min Deposit
- Score
- Visit Broker

- Award-winning Cryptocurrency trading platform
- $100 minimum deposit,
- FCA & Cysec regulated

- 20% welcome bonus of upto $10,000
- Minimum deposit $100
- Verify your account before the bonus is credited
- Fund Moneta Markets account with a minimum of $250
- Opt in using the form to claim your 50% deposit bonus
Learn to Trade
Never Miss A Trade Again

Signal Notification
Real-time signal notifications whenever a signal is opened, closes or Updated

Get Alerts
Immediate alerts to your email and mobile phone.

Entry Price Levels
Entry price level for every signal Just choose one of our Top Brokers in the list above to get all this free.