Key Resistance Levels: $35, $37.50, $40
Key Support Levels: $25,$22.50,$20
DOT/USD Price Long-term Trend: Bullish
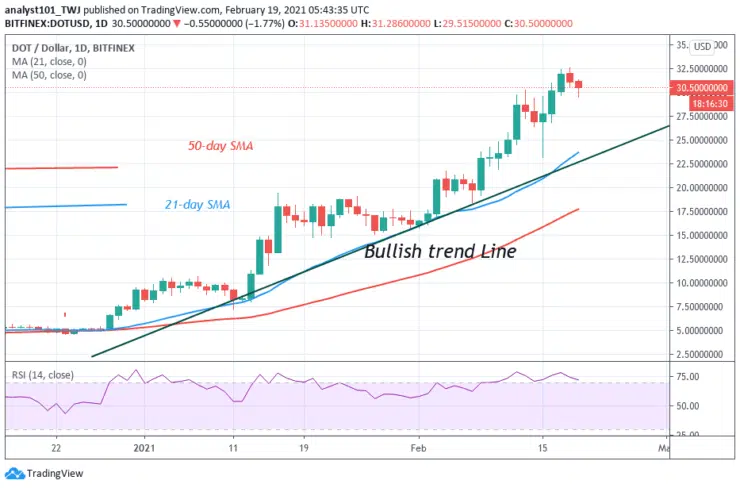
The cryptocurrency is in a smooth uptrend. DOT price is making a series of higher highs and higher lows. The coin is currently making higher highs at a price of $32.50. The altcoin is retracing from the recent high. The recent price fall was a result of the overbought nature of the coin. The RSI is indicating that the price has not enough room to rally on the upside. The uptrend will resume as long as price is above the SMAs. Today, the price has retraced and found support above $30. The upward move will resume if the current support holds. On the upside, if price breaks the current resistance the market will rise to the next target price of $45.
Daily Chart Indicators Reading:
A bullish trend line is drawn showing the support levels of price. The uptrend will continue if price retraces and bounces above the trend line. Conversely, if price breaks and closes below the trend line, the uptrend is likely to be terminated. DOT is at level 74 of the Relative Strength Index period 14. This indicates that the pair is in the uptrend zone.
DOT/USD Medium-term Trend: Bullish
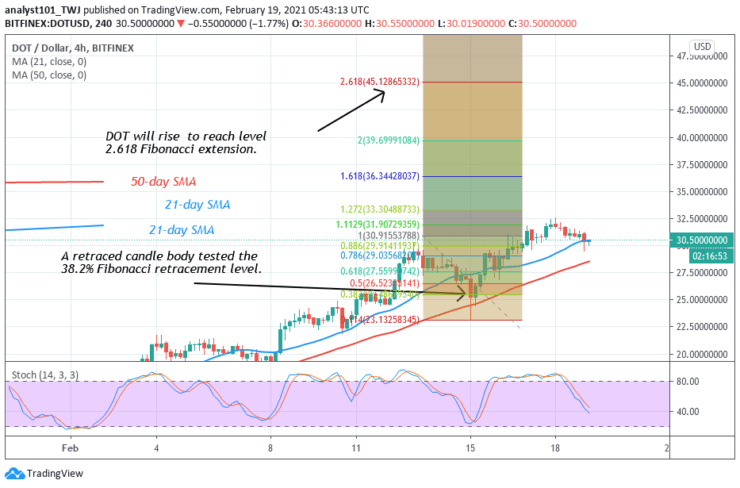
On the 4-hour chart, the pair is in an upward move. On February 13 uptrend; a retraced candle body tested the 38.2% Fibonacci retracement level. The retracement indicates that the DOT price will rise to level 2.618 Fibonacci extensions or the high of $45.12 .
4-hour Chart Indicators Reading
The altcoin is currently below the 40% range of the daily stochastic. It indicates that the pair is in a bearish momentum because of the earlier price fall. The SMAs are sloping upward indicating an uptrend.
General Outlook for Polkadot (DOT)
The cryptocurrency upward move is ongoing as price finds support above $30 support. According to the Fibonacci tool, the market will rise to level 2.618 Fibonacci extension. That is a high of $45.12.
You can purchase crypto coins here: Buy Coins
Note: Learn2Trade.com is not a financial advisor. Do your research before investing your funds in any financial asset or presented product or event. We are not responsible for your investing results
- Broker
- Min Deposit
- Score
- Visit Broker

- Award-winning Cryptocurrency trading platform
- $100 minimum deposit,
- FCA & Cysec regulated

- 20% welcome bonus of upto $10,000
- Minimum deposit $100
- Verify your account before the bonus is credited
- Fund Moneta Markets account with a minimum of $250
- Opt in using the form to claim your 50% deposit bonus
Learn to Trade
Never Miss A Trade Again

Signal Notification
Real-time signal notifications whenever a signal is opened, closes or Updated

Get Alerts
Immediate alerts to your email and mobile phone.

Entry Price Levels
Entry price level for every signal Just choose one of our Top Brokers in the list above to get all this free.