Don’t invest unless you’re prepared to lose all the money you invest. This is a high-risk investment and you are unlikely to be protected if something goes wrong. Take 2 minutes to learn more
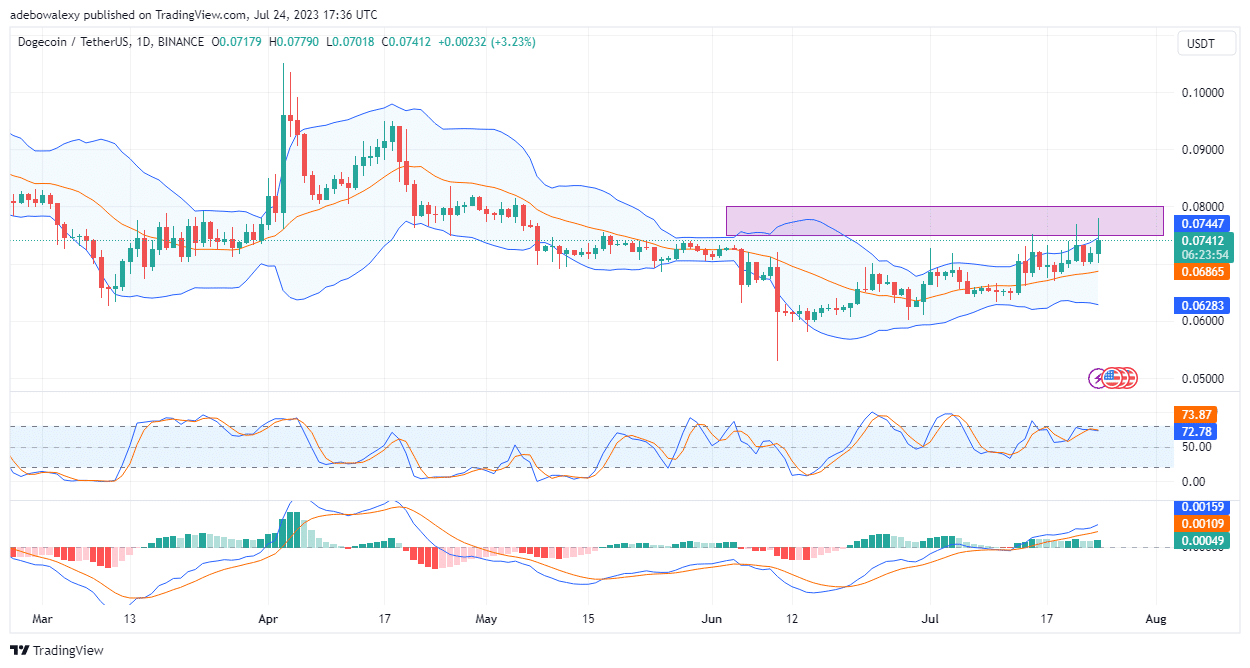
Price activity in the Dogecoin market is suggesting that the price of this token may soon break into the price region of $0.07500 and $0.08000. Also, most of the indications from technical indicators seem to align with this opinion, so let’s see how this may occur.
DOGE Statistics
Dogecoin Value Now: $0.07412
DOGE Market Cap: $10,484,007,208
Dogecoin Circulating Supply: 140,307,516,384
DOGE Total Supply: 140,307,516,384
DOGE CoinMarketCap Ranking: 8
Major Price Levels:
Top: $0.07412, $0.07500, and $0.08000
Base: $0.07400, $0.07350, and $0.07300

Dogecoin May Set a New Upside Course
Price action in the Dogecoin market appears to keep gaining upside traction. Also, going by most of the indications arising from trading indicators, it is reasonable enough to maintain this opinion.
Since about eleven trading sessions ago, price action has remained above the middle limit of the Bollinger Bands. Also, it appears to maintain a slight upside path, while in the ongoing session, price action seems to have increased in upside volatility considerably.
This can be seen as the last price candle on this chart has slightly pushed the upper band of the Bollinger Bands indicator. Meanwhile, the Relative Strength Index (RSI) indicator seems undecided yet concerning further price increases.
However, the Moving Average Convergence Divergence (MACD) indicator is showing that upside momentum is healthy enough to maintain the upside focus. This can be perceived as the lines of this indicator keeping trending upwards while the last histogram bar on it is now solid green.
.07500–


DOGE Seems Preparing to Revisit Price Levels above the $0.07500 Mark
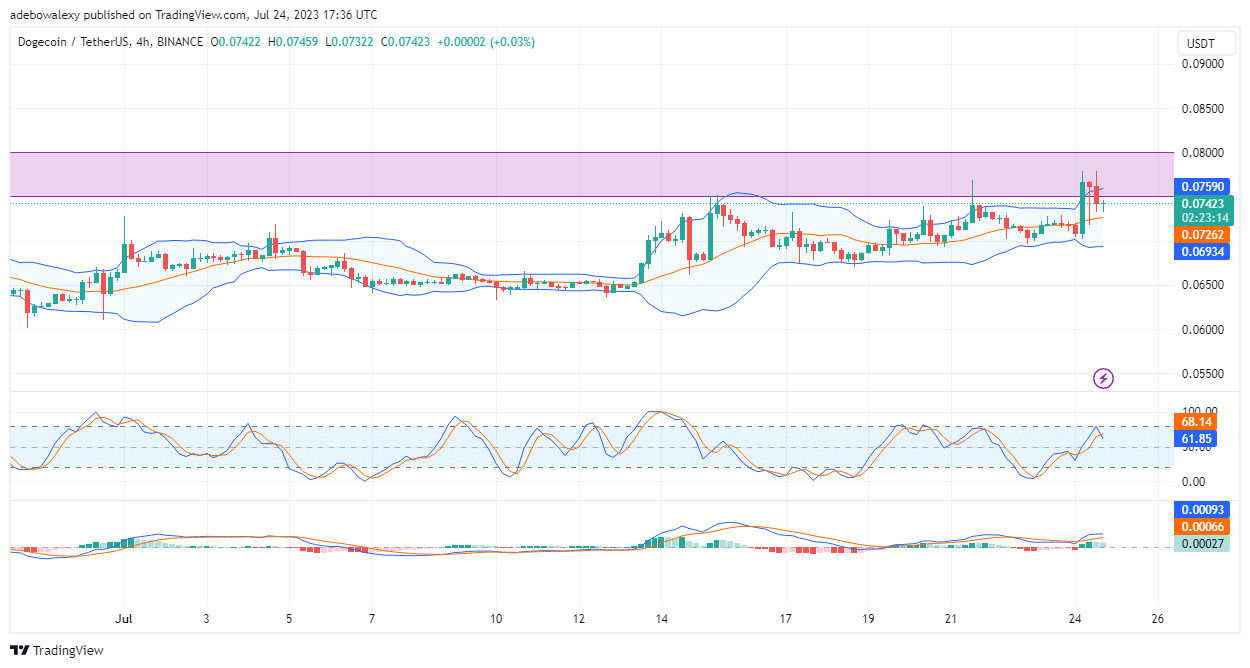
The DOGE 4-hour market is revealing that price action has just recently visited price marks above $0.07500. However, no sooner than this occurred, headwinds presented a rejection, which pushed price action out of that region.
Nevertheless, the last trading session showed that bulls are resisting further downward corrections. This can be seen as a dashed-shaped green price candle appearing above the middle limit of the Bollinger Bands indicator.
Meanwhile, the MACD indicator lines are still above the equilibrium level. Also, the lines of the MACD seem to keep trending in a slightly upside manner, despite the pale green appearance of its bars. So, bullish traders can still maintain their upside hopes towards the $0.08000 price mark.
- Broker
- Min Deposit
- Score
- Visit Broker
- Award-winning Cryptocurrency trading platform
- $100 minimum deposit,
- FCA & Cysec regulated
- 20% welcome bonus of upto $10,000
- Minimum deposit $100
- Verify your account before the bonus is credited
- Fund Moneta Markets account with a minimum of $250
- Opt in using the form to claim your 50% deposit bonus
Learn to Trade
Never Miss A Trade Again


Signal Notification
Real-time signal notifications whenever a signal is opened, closes or Updated


Get Alerts
Immediate alerts to your email and mobile phone.


Entry Price Levels
Entry price level for every signal Just choose one of our Top Brokers in the list above to get all this free.


