
Key Resistance Levels: $0.45, $0.46, $0.47
Key Support Levels: $0.25, $0.20,$0.15
DOGE/USD Long-term Trend: Bullish
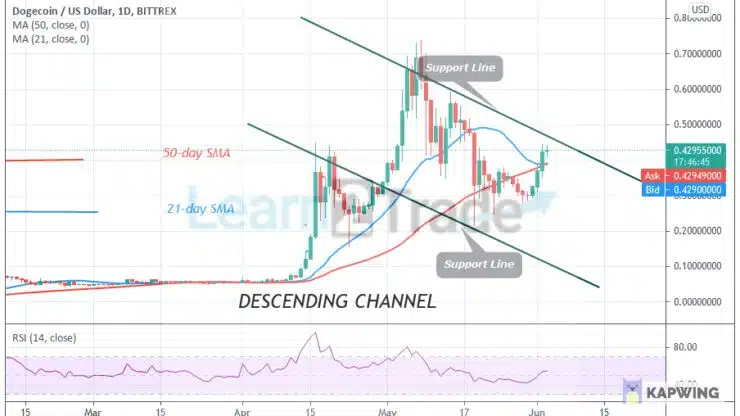
Since May 19, DOGE’s price fell to $0.215 low and pulled back above $0.30. For the past two weeks, Dogecoin has been consolidating above the $0.30 support. Yesterday, the DOGE price broke above the moving averages and continued the bullish momentum. The coin will continue to rise as long as the price bars are above the SMAs. On June 1, the crypto rebounded above the $0.32 support to reach the high of $0.44. Since June 2, the bulls have been attempting to break the resistance at $0.44. Dogecoin now consolidates between $0.40 and $0.44 for a further upward move.
Daily Chart Indicators Reading:
DOGE price is at level 54 of the Relative Strength Index period 14. It indicates that the altcoin is in the bullish trend zone and above the centerline 50. The 21-day and 50-day SMAs are sloping downward indicating the downtrend
DOGE/USD Medium-term bias: Bullish
On the 4 hour chart, the DOGE price is in an uptrend. The crypto’s price has broken above the moving averages and rallied to $0.44 high. On June 2 uptrend; a retraced candle body tested the 78.6 % Fibonacci retracement level. The retracement indicates that DOGE will rise to level 1.272 Fibonacci extensions or level $0.482 and reverse. The coin will reverse to 78.6% Fibonacci retracement level where it originated.


