
Key Resistance Levels: $0.09, $0.10, $0.11
Key Support Levels: $0.03, $0.02,$0.01
DOGE/USD Long-term Trend: Ranging
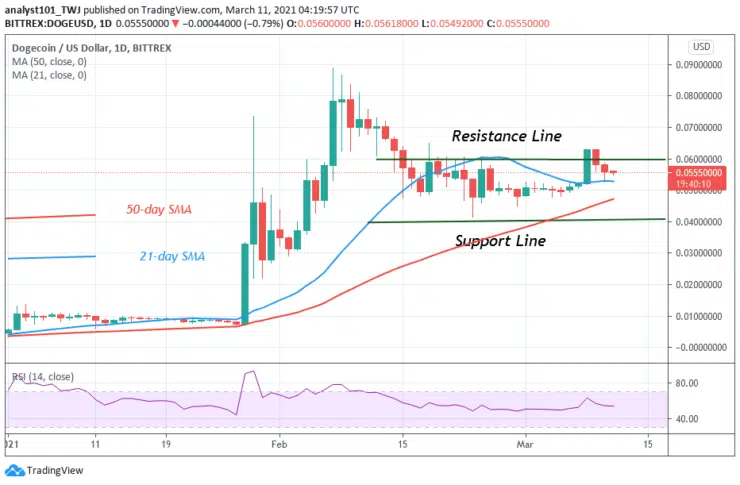
DOGE has continued its range-bound move between $0.040 and $0.060. On March 8, the bulls broke the range-bound movement but the uptrend could not be sustained. The selling pressure pushed the price to the range-bound zone. Presently, DOGE is falling to the lower price range. The range-bound move is likely to continue for a few more days.
Daily Chart Indicators Reading:
DOGE is at level 53 of the Relative Strength Index period 14. It indicates that the coin is in the uptrend zone and above the centerline 50. The 50-day and 21-day SMAs are sloping horizontally indicating the sideways move.
DOGE/USD Medium-term bias: Bearish
On the 4 hour chart, the crypto is falling. After the breakdown on March 9, the price corrected upward to retest the $0.058 high. On March 9 downtrend, a retraced candle body tested the 78.6% Fibonacci retracement level. The retracement indicates that DOGE will fall to level 1.272 Fibonacci extension and reverse. That is the low of $0.0539.


