
Dogecoin (DOGE) Price Long-term Prediction: Bearish
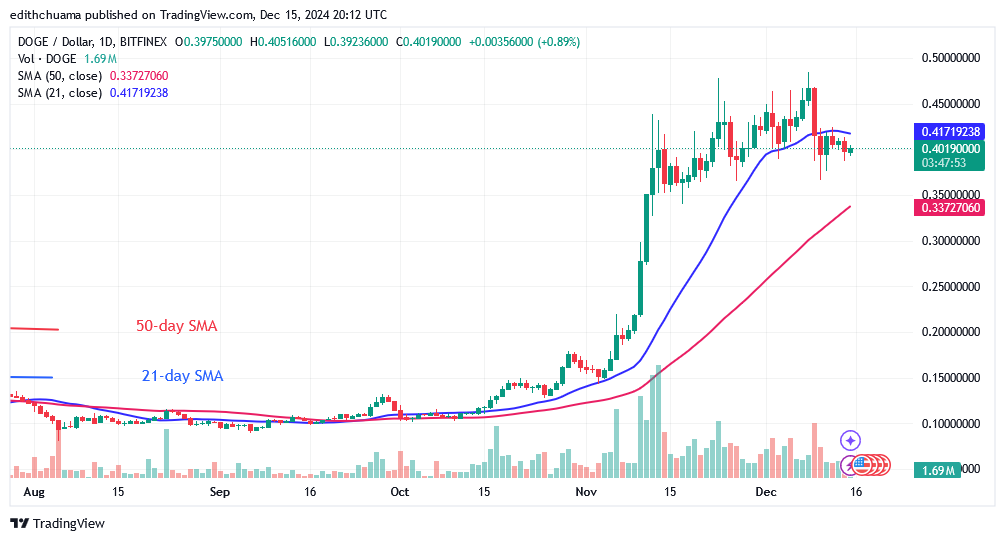
Dogecoin’s (DOGE) price falls between the moving average lines but may drop below the $0.32 low. The bullish trend has peaked at $0.45 since November 12. DOGE has been trading below the resistance at $0.45 but above the 21-day SMA support during the past month. Buyers failed to maintain their bullish momentum above the $0.45 high.
Technical indicators
Major Resistance Levels – $0.50 and $0.55
Major Support Levels – $0.40 and $0.35
Dogecoin (DOGE) Indicator Reading
The price bars remain caught between the moving average lines. The price bars are settling beneath the 21-day SMA but above the 50-day SMA. The price movement has remained steady due to the presence of Doji candlesticks. As the bullish trend comes to an end, the moving average lines on the daily chart continue to slope upward.
What is the next direction for Dogecoin (DOGE)?
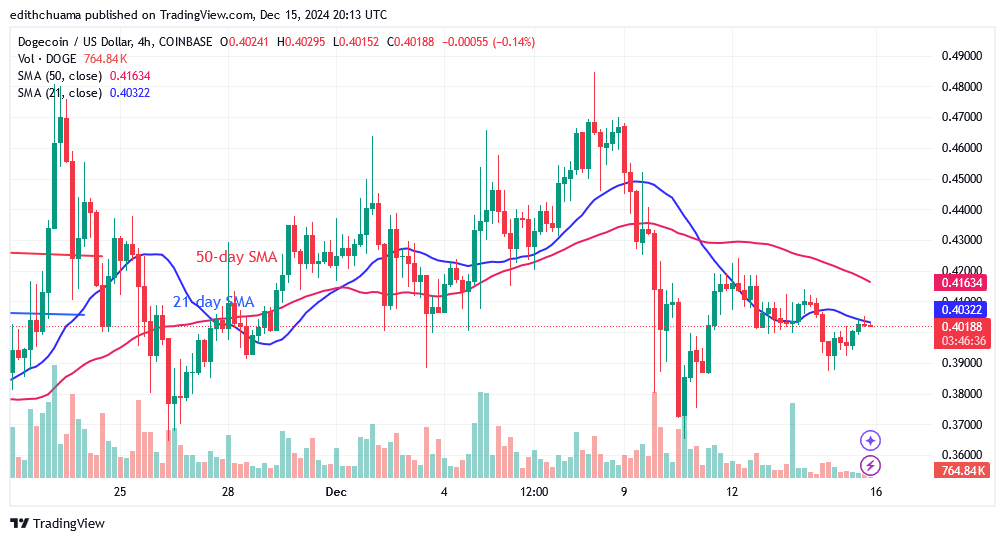
On the 4-hour chart, DOGE is declining below the moving average lines and may drop below the $0.32 low. The moving averages have impeded the upward correction. The altcoin is trading in a band of $0.37 to $0.42. DOGE will restart its bullish trend once it breaks above the moving average lines and resistance at $0.45. Currently, the crypto signal is range-bound as the altcoin prepares to resume its ascent.
Make money without lifting your fingers: Start using a world-class auto trading solution.
Note: Learn2.Trade is not a financial advisor. Do your research before investing your funds in any financial asset or presented product or event. We are not responsible for your investing results.


