
Dogecoin (DOGE) Price Long-term Prediction: Bearish
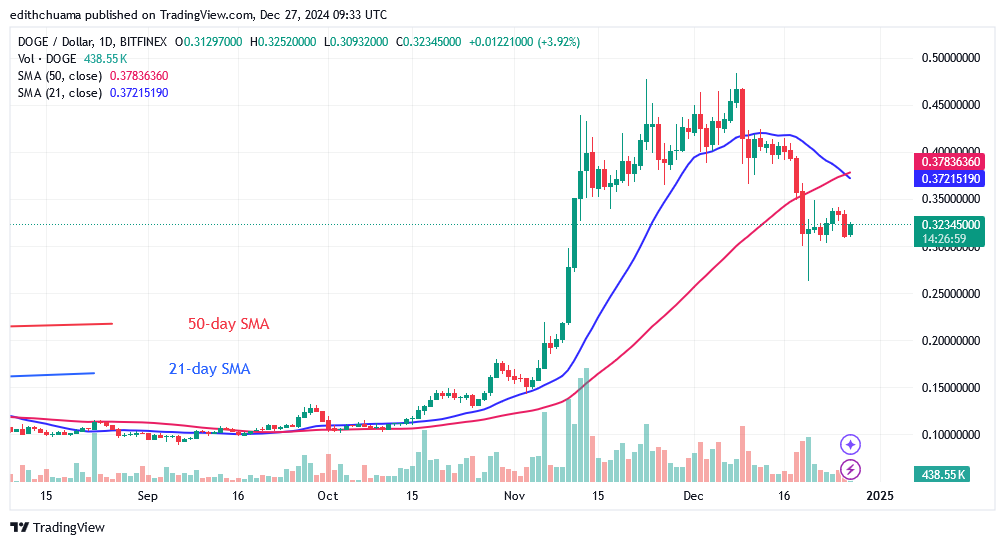
Dogecoin (DOGE) price activity has stayed unchanged as it moves sideways around its $0.30 low. On December 20, DOGE reached a low of $0.26 before recovering. The altcoin has consolidated above the $0.30 support but below the 50-day SMA throughout the past week.DOGE’s price has remained stable above its present support. Price consolidation is dominated by the Doji candlestick, which has a small body and is indecisive.
Technical indicators
Major Resistance Levels $0.45 and $0.50
Major Support Levels – $0.30 and $0.25
Dogecoin (DOGE) Indicator Reading
DOGE is consolidating above the $0.30 barrier, and price movement has been static. There are two candlestick wicks with tails pointing to their respective ends. The candlestick wick points to the 50-day SMA, indicating significant selling pressure at the current peak. On the downside, the candlestick tail points to the $0.26 support, indicating strong purchasing pressure at the current level.
What is the next direction for Dogecoin (DOGE)?
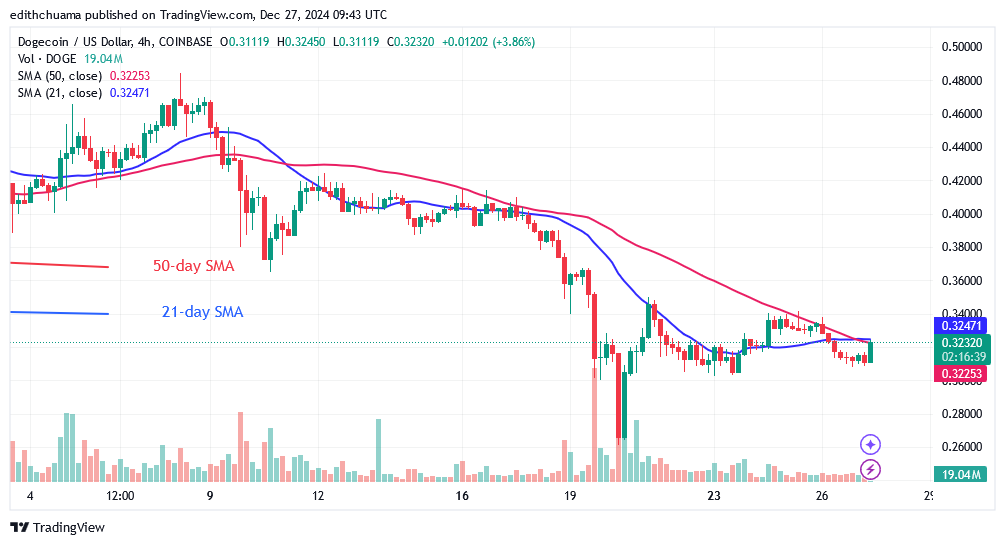
The 4-hour chart shows DOGE consolidating as it moves sideways around its $0.30 low. The price movement has been limited to the $0.30 support and moving average lines. Meanwhile, the range-bound trend will continue for a few days.
Make money without lifting your fingers: Start using a world-class auto trading solution.
Disclaimer. This analysis and forecast are the personal opinions of the author. They are not a recommendation to buy or sell cryptocurrency and should not be viewed as an endorsement by Coin Idol. Readers should do their research before investing in funds.


