

DeFI Coin Price Forecast – Expert Analysis & Trading Tips | Learn 2 Trade – Expert Analysis & Trading Tips | Learn 2 Trade – Expert Analysis & Trading Tips | Learn 2 Trade – Expert Analysis & Trading Tips | Learn 2 Trade – September 2
The DeFI Coin price forecast confirms the resumption of buyer’s activities as the DEFC price prepares for another climb to the price level at $0.07800.
DEFCUSD Long-Term Trend: Bullish (1-Hour Chart)
Significant Levels:
Supply zone: $0.07800, $0.06960
Demand zone: $0.07160, $0.06740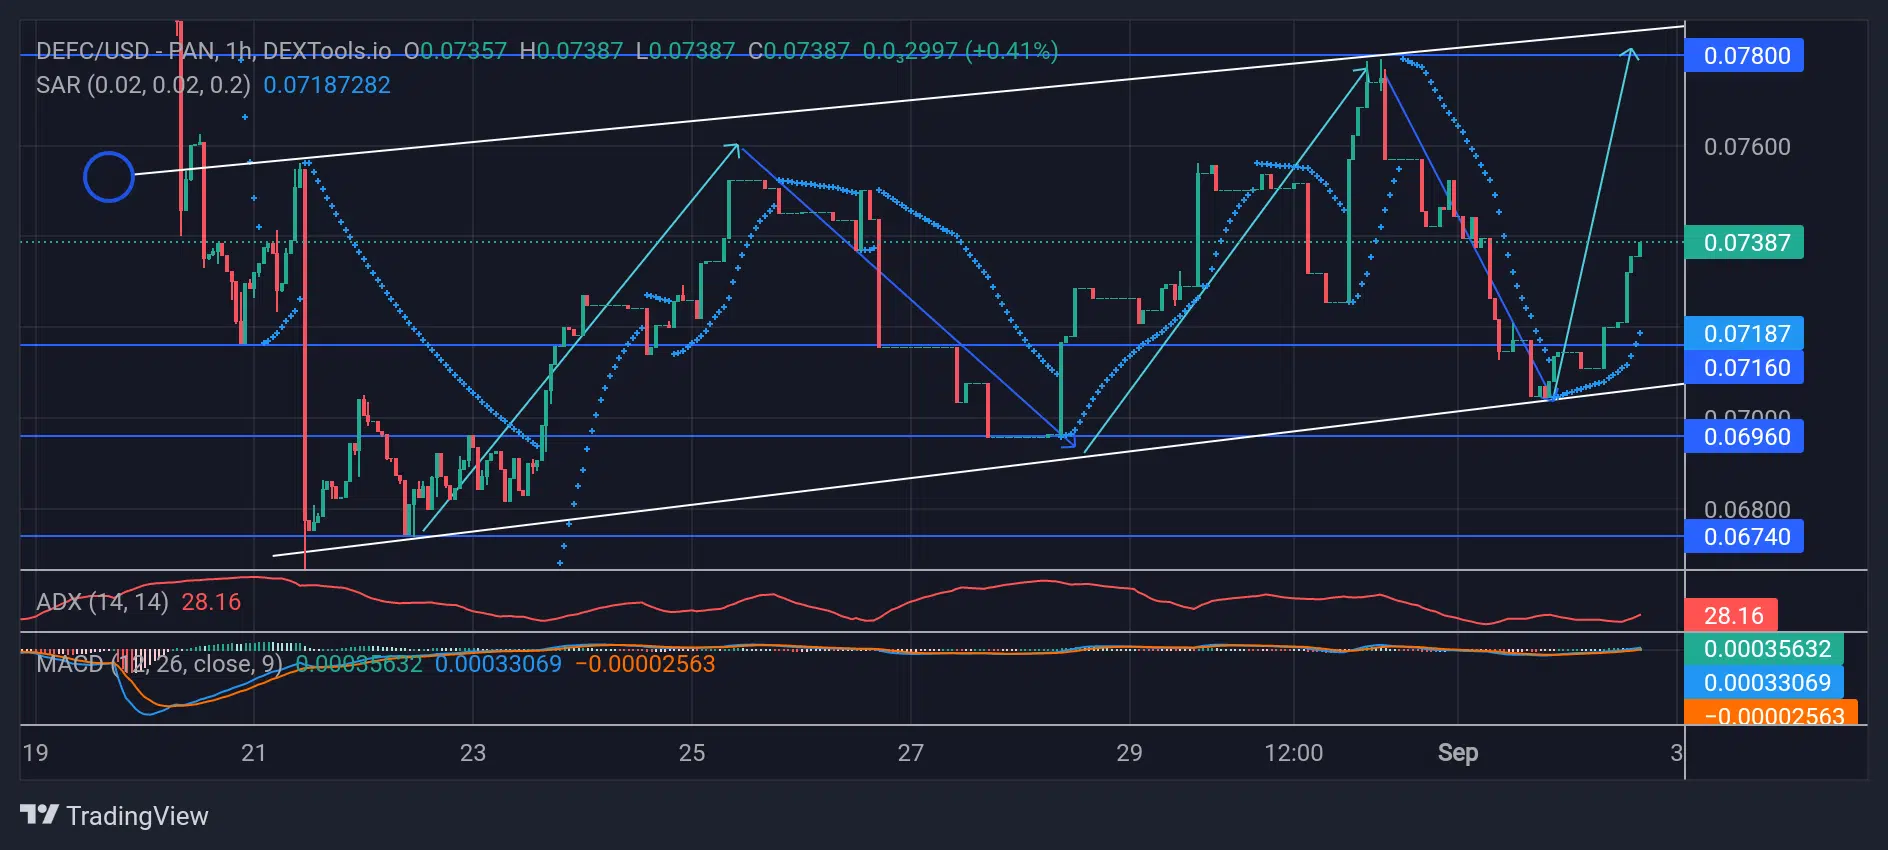
The DEFC market has continued its regular pattern within the bullish channel. The DEFI price is now expected to break out of the higher supply zone and is expected to form a new higher high slightly above this region.
DeFI Coin Price Forecast – Expert Analysis & Trading Tips | Learn 2 Trade – Expert Analysis & Trading Tips | Learn 2 Trade – Expert Analysis & Trading Tips | Learn 2 Trade – Expert Analysis & Trading Tips | Learn 2 Trade: Market Outlook
The indication being given by the Average Directional Index is that the downward trend formed in a bid to retest previous prices is already waning. It can already be seen on the chart that there has been a structural shift, and the market is already moving in an upward trend.
The MACD (Moving Average Convergence and Divergence) indicator shows the market has stopped moving in its initial direction. As the market is currently correcting upward, some contention can still be seen between the buyers and sellers. However, all indications point to an uptrend return for the DeFC price.
The Parabolic SAR (Stop and Reverse) indicates a steady market takeover by the bulls. It shows that the current market movement after the most recent low (higher-low more precisely) is the bulls’ attempt to bring prices higher.
DEFC Medium-Term: Trend Bullish (15-Minute Chart)
The shorter time frame of the 15-minute chart also confirms with certainty that the recent market shift from the $0.07100 region will culminate in a strong impulsive run up the price chart.

These movements are expected to lead sooner than later to the formation of a new higher high within the market’s bullish trend after it must have broken the restriction area.
You can purchase DeFi Coin here: Buy DEFC
Note: Learn2.trade is not a financial advisor. Do your research before investing your funds in any financial asset or presented product or event. We are not responsible for your investing results.


