DeFI Coin Price Forecast – Expert Analysis & Trading Tips | Learn 2 Trade – Expert Analysis & Trading Tips | Learn 2 Trade – Expert Analysis & Trading Tips | Learn 2 Trade – Expert Analysis & Trading Tips | Learn 2 Trade: October 16
The DeFi Coin price forecast says the coin price has broken out of the falling wedge and will return to a bullish phase afterward. After retesting the demand price of $0.06740, the price has begun its sojourn up the price chart.
DEFCUSD Long-Term Trend: Bullish (1-Hour Chart)
Significant Levels:
Supply zone: $0.07660, $0.07110
Demand zone: $0.07250, $0.06740
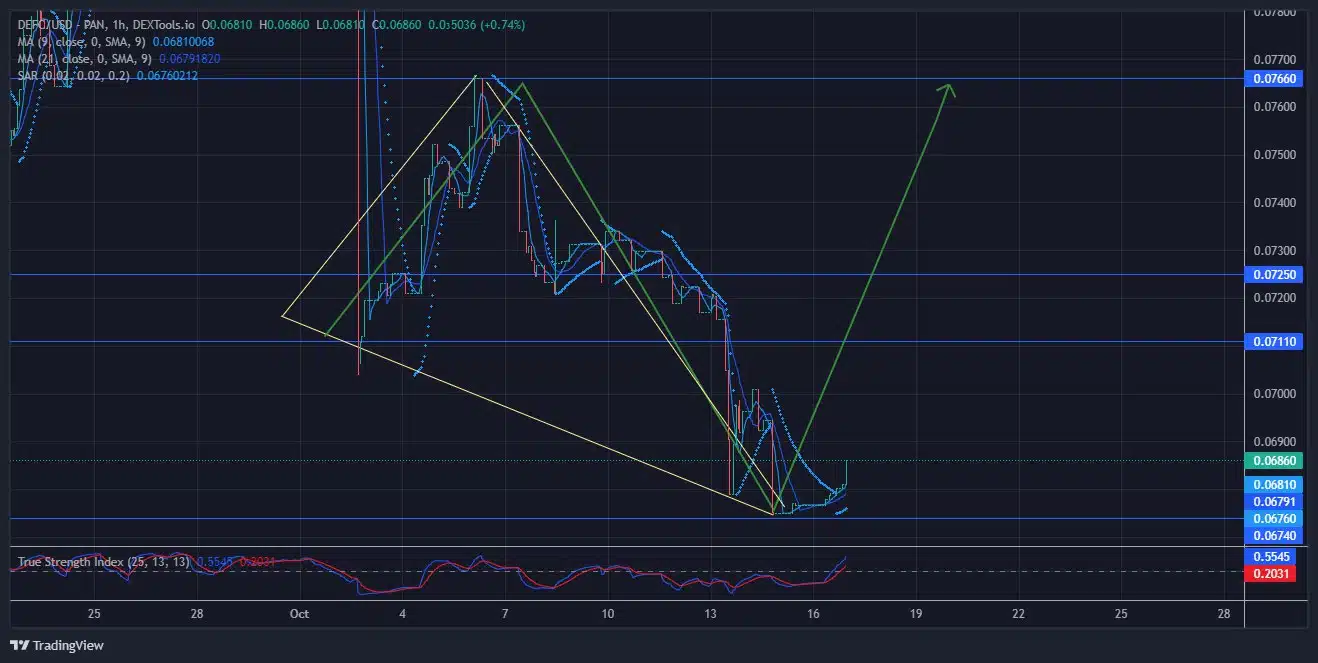
The DEFC market at first made a slow breakout from the wedge, remaining around the support level it retested. However, the DEFCUSD market has risen significantly from that point and is currently at $0.06860.
DeFI Coin Price Forecast – Expert Analysis & Trading Tips | Learn 2 Trade – Expert Analysis & Trading Tips | Learn 2 Trade – Expert Analysis & Trading Tips | Learn 2 Trade – Expert Analysis & Trading Tips | Learn 2 Trade: Market Outlook
The Parabolic SAR (Stop and Reverse) indicator has started to reflect the bullish breakout the price made. The Parabolic indicator has now lined up below the recently formed long candlesticks.
The Moving Average indicator has confirmed the DEFC’s bullish position against the USD, as it is already below the candles. Period 9, and even the 21, has started to move in support of the coin’s bullishness.
The True Strength Index has threaded past the signal line, suggesting a bullish market return. The price retest at the support level brought in several buy-trades after a week of excessive selling by the bears.
DEFC Medium-Term: Trend Bullish (15-Minute Chart)
During the 15-minute time frame, the Parabolic SAR maintains the same stance regarding the coin price position and direction. The indicator has lined up across the candlestick, showing the bullish pressure injected into the market.

With the MA period 9 and 21 indications, the market should continue with this move up the price chart. However, a second retest of the $0.06740 price level is expectable, as the TSI suggests that the coin has been overbought.
You can purchase DeFi Coin here: Buy DEFC
Note: Learn2.trade is not a financial advisor. Do your research before investing your funds in any financial asset or presented product or event. We are not responsible for your investing results.