DeFI Coin Price Forecast – Expert Analysis & Trading Tips | Learn 2 Trade – Expert Analysis & Trading Tips | Learn 2 Trade – Expert Analysis & Trading Tips | Learn 2 Trade – Expert Analysis & Trading Tips | Learn 2 Trade: June 6
The DeFI Coin price forecast is ascending as the market violates the bear channel. The descending trend line above the intraday candles has failed to resist the upward movement of price.
DEFCUSD Long-Term Trend: Bullish (1 hour chart)
DEFCUSD Significant Levels:
Resistance level: $0.3850, $0.3280
Support Level: $0.3560, $0.2950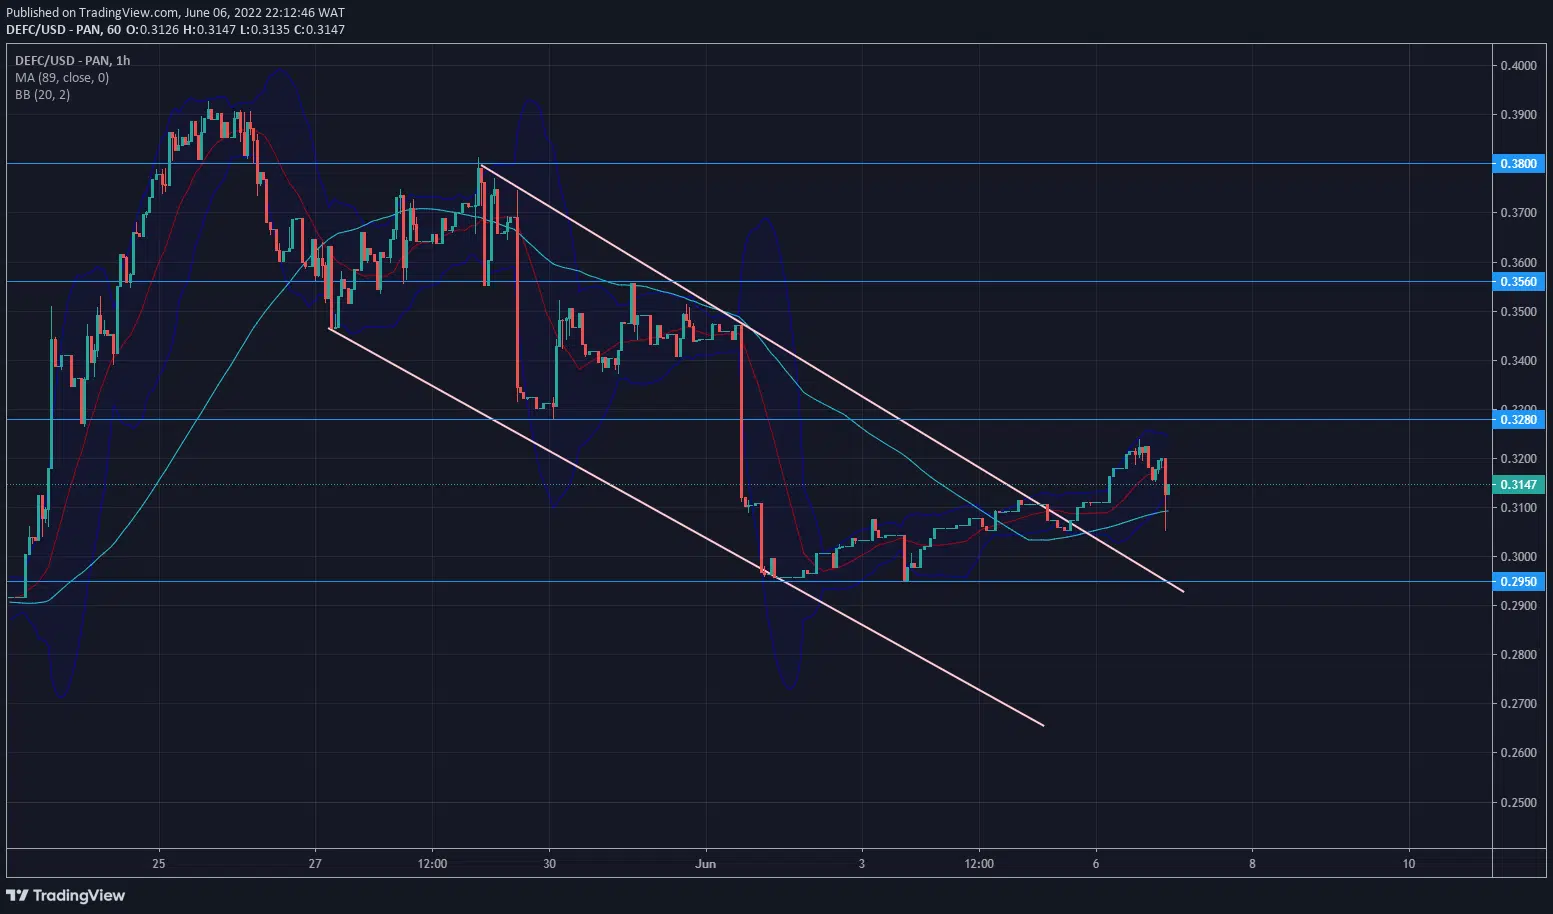
DeFI Coin Price Forecast – Expert Analysis & Trading Tips | Learn 2 Trade – Expert Analysis & Trading Tips | Learn 2 Trade – Expert Analysis & Trading Tips | Learn 2 Trade – Expert Analysis & Trading Tips | Learn 2 Trade: Market Outlook
The DeFI coin resistance level prevented further price ascension at $0.3800. There was a bearish structural market shift. The market touched the borders of the Bollinger bands at the resistance level. This facilitated the sell-off at the key level.
The market found temporary support at $0.3280. The lower bands of the Bollinger were struck at the same time the key level was hit. This caused the price to rise. The previous mitigation block was hit to resist the price rise. This led to the final sell-off on DeFI.
The market reached the demand level at $0.2950 as June opened. The demand zone was tested twice. The lower bands of the Bollinger gave further support. The candles leapt off the support level.
DEFC Medium-Term: Trend Bullish (15-minute chart)
On the 15-minute chart, the intraday candles have broken the trend line, acting as the channel resistance. The candles have also risen above the Moving Average. 
You can purchase DeFi Coin here: Buy DEFC
Note: Learn2.trade is not a financial advisor. Do your research before investing your funds in any financial asset or presented product or event. We are not responsible for your investing results.
- Broker
- Min Deposit
- Score
- Visit Broker

- Award-winning Cryptocurrency trading platform
- $100 minimum deposit,
- FCA & Cysec regulated

- 20% welcome bonus of upto $10,000
- Minimum deposit $100
- Verify your account before the bonus is credited


- Fund Moneta Markets account with a minimum of $250
- Opt in using the form to claim your 50% deposit bonus