Don’t invest unless you’re prepared to lose all the money you invest. This is a high-risk investment and you are unlikely to be protected if something goes wrong. Take 2 minutes to learn more
Price action in the Decentraland daily market can be seen heading upwards. This token has continued to see minimal upward gains after its price action crossed the $0.3000 threshold. Indications that the market may still rise further can be seen on the chart; however, this calls for more careful observation.
MANA Statistics:
Decentraland MANA Price: $0.30
Decentraland Market Cap: $634,497,615
Circulating Supply of MANA: 1,908,319,865
Decentraland Total Supply: 2,193,179,327
MANA CoinMarketCap Rank: 106
.3500 Price Level" width="580" height="293" data-lazy-src="https://learn2.trade/wp-content/uploads/2024/09/MANAUSDT_2024-09-27_14-23-37_022754-1024x517.png"/>
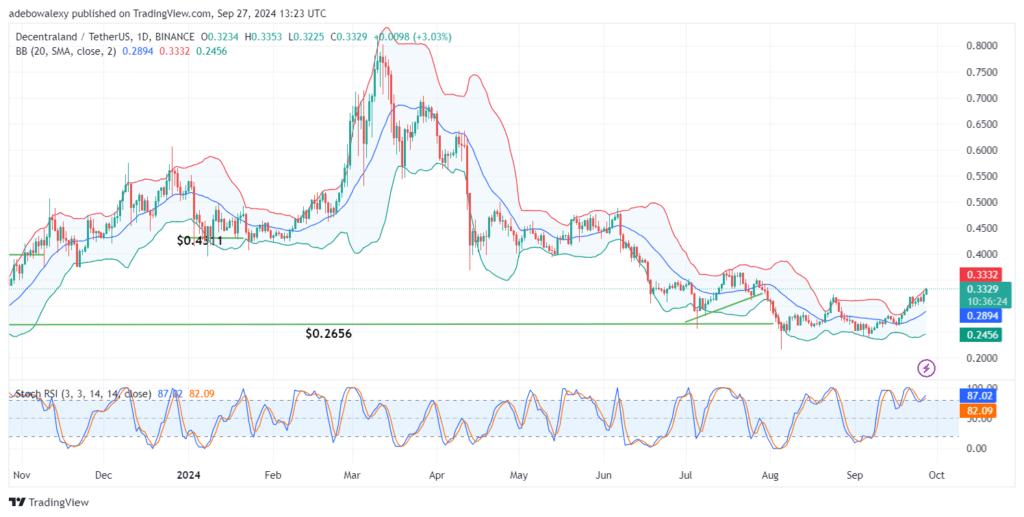
Decentraland Hugs the Ceiling of the Bollinger Bands
Price activity in the MANA daily price chart has continued to rise toward higher price levels. The market has bounced off the technical support at the $0.3000 threshold. Meanwhile, the upper part of the Bollinger Bands is taking an upward trajectory.
The ongoing session can be seen hugging the ceiling of the Bollinger Bands. Similarly, the Stochastic Relative Strength Index (Stochastic RSI) lines have already delivered an upward crossover at the 80 level of the indicator. All this is happening while volatility remains modest.
.3500 Price Level" width="580" height="293" data-lazy-src="https://learn2.trade/wp-content/uploads/2024/09/MANAUSDT_2024-09-27_14-24-02_022753-1024x517.png"/>
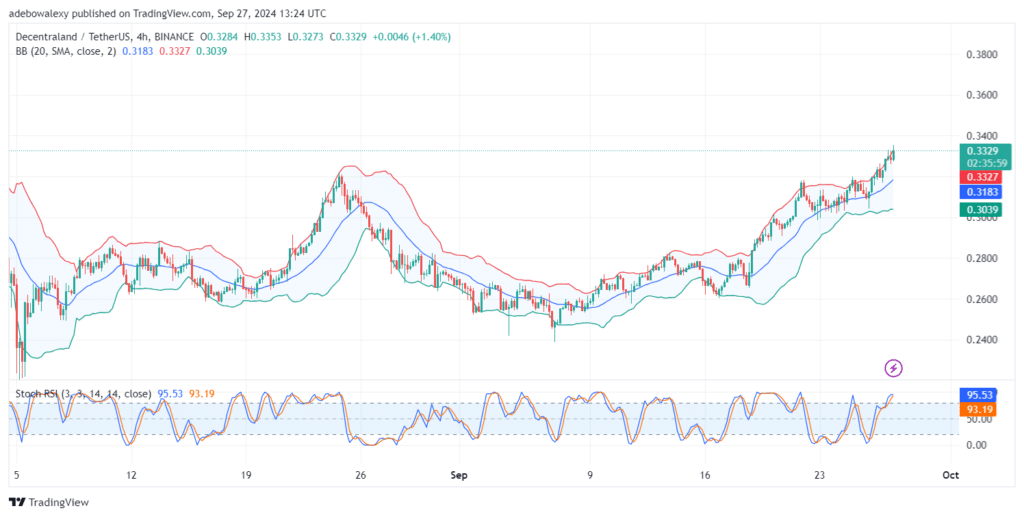
MANA Maintains a Largely Promising Outlook
In the Decentraland 4-hour market, price activity still largely sticks to a bullish path. The last price candle can still be seen brushing against the ceiling of the BB indicator. However, it seems headwinds are already affecting the session, as evidenced by the appearance of an upper shadow. As a result, the upper Stochastic RSI lines appear to be converging as if approaching a crossover.
The Stochastic RSI curves are already in the overbought region. Therefore, a crossover may occur here, leading to a retracement, and traders must prepare for this while using crypto signals targeting the $0.3750 threshold.
Trade on MT4 with Leverage up to 1:500! Trade on MT4 with Leverage up to 1:500!
X
We use cookies to ensure that we give you the best experience on our website. If you continue to use this site we will assume that you are happy with it.
 .3500 Price Level" width="580" height="293" data-lazy-src="https://learn2.trade/wp-content/uploads/2024/09/MANAUSDT_2024-09-27_14-23-37_022754-1024x517.png"/>