Don’t invest unless you’re prepared to lose all the money you invest. This is a high-risk investment and you are unlikely to be protected if something goes wrong. Take 2 minutes to learn more
The Dash 2 Trade market has experienced significant volatility recently, leading to wide price fluctuations over the past trading sessions. Despite this high volatility, it appears that bulls have managed to maintain control.
Dash 2 Trade Bulls Stay in Control Despite Choppy Price Activity
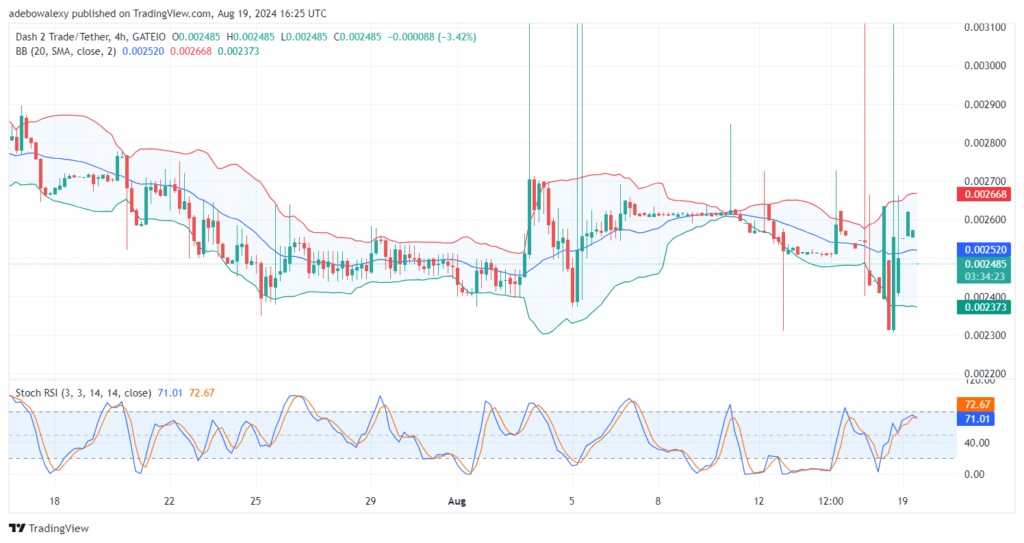
The last price candle on the D2T 4-hour chart shows a bullish appearance, although it appears as a dash-shaped candle below the middle limit of the Bollinger Bands (BB) indicator. The BB indicator is expanded to reflect the volatility in price movement.
The Stochastic Relative Strength Index (SRSI) indicator is above the 70 mark, and the strength of the upward forces has prevented the indicator lines from descending.
D2T Market Lurks Around an Important Landmark
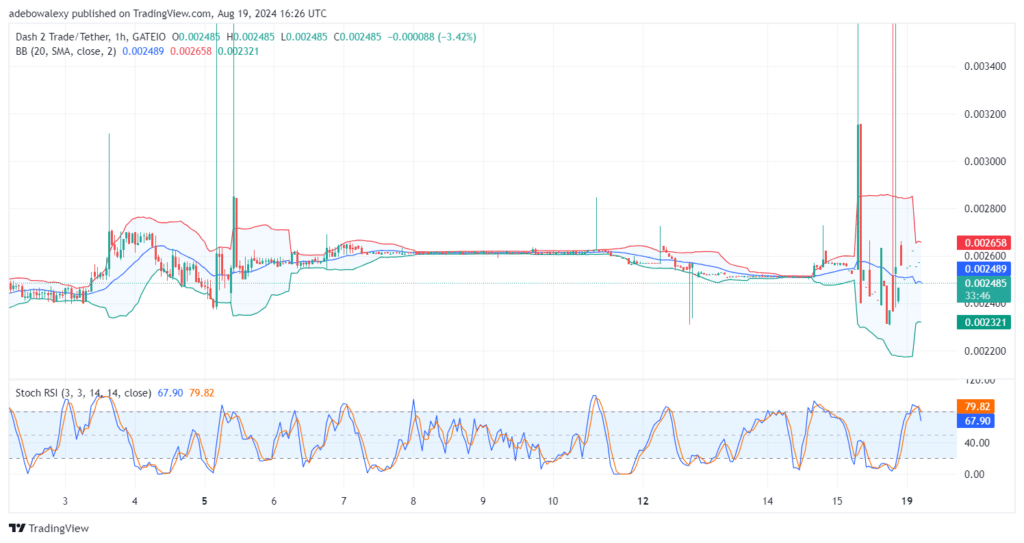
While price action in the 4-hour D2T market has fallen below the middle limit of the Bollinger Bands, the hourly market shows that the ongoing session is already testing the middle limit of the Bollinger Bands, aiming to break above it.
At the same time, the SRSI indicator lines are still above the 60 level, suggesting that upside forces may easily push the market back up. This potential rise could be facilitated by the ongoing price volatility. Consequently, traders may chose to use crypto signals targeting price levels above $0.002600 but below $0.002700 for short-term gains. Additionally, here are the top 5 Smart Money purchases in the last 24 hours:
Ethereum ($ETH)
Sifu ($SIFU)
Manifold Finance ($FOLD)
Neiro ($NEIRO)
Flip ($FLIP)
🚀Smart Money Insights📊
Smart Money is individuals & entities who are seen as experienced & informed, often signaling future trends.
Trade on MT4 with Leverage up to 1:500! Trade on MT4 with Leverage up to 1:500!
X
We use cookies to ensure that we give you the best experience on our website. If you continue to use this site we will assume that you are happy with it.