Don’t invest unless you’re prepared to lose all the money you invest. This is a high-risk investment and you are unlikely to be protected if something goes wrong. Take 2 minutes to learn more
Price activity on the Curve (CRV) daily market has been gaining significant traction in recent days. As a result, the token’s price has risen past key levels, potentially indicating further price increases in the near term. Let’s explore the current market behavior below.
Curve Statistics
CRV Current Price: $0.6175
Market Capitalization: $796.75M
Circulating Supply: 1.31B
Total Supply: 2.24B
CoinMarketCap Rank: 71
Key Price Levels
Resistance: $0.6500, $0.7000, $0.7500
Support: $0.6000, $0.5500, $0.5000
 .7000 Price Level" width="1436" height="606" data-lazy-src="https://learn2.trade/wp-content/uploads/2025/04/CRVUSDT_2025-04-16_06-13-30.png"/>
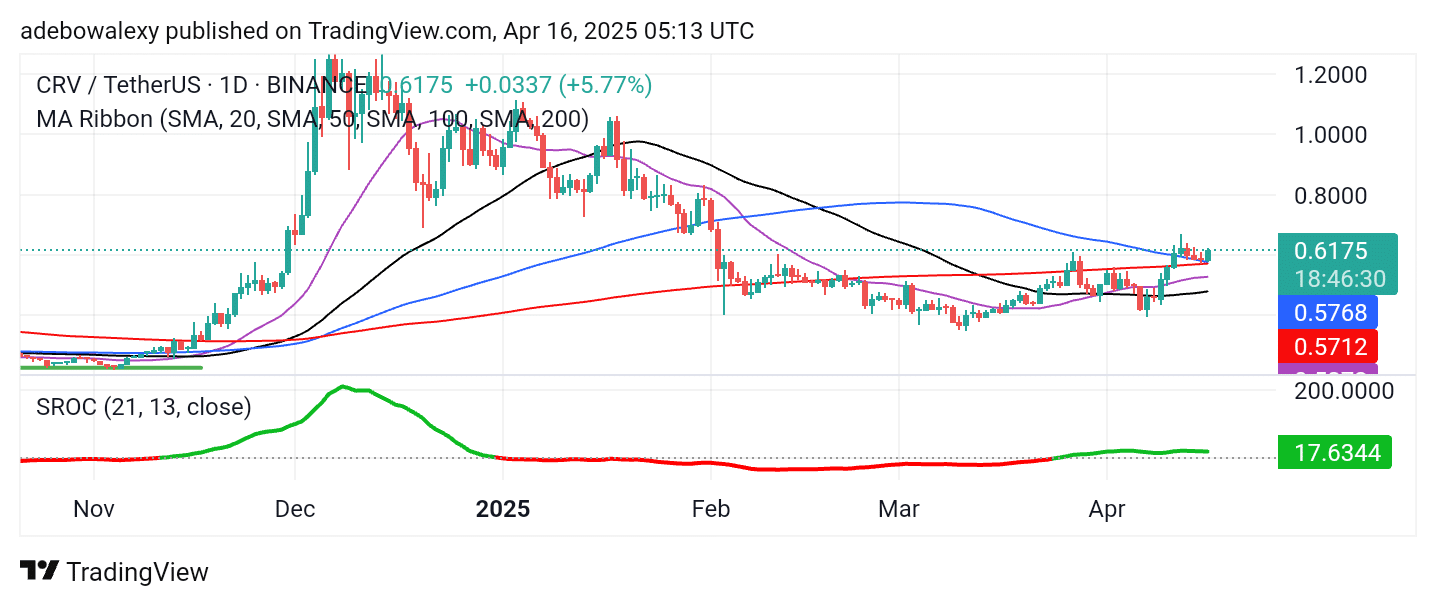
CRV Market Continues to Show Notable Progress
The Curve token on the daily chart has shown significant progress, breaking through key technical levels. The latest price candle stands above all the Moving Average (MA) lines, suggesting bullish strength. Interestingly, the market appears to have rebounded upward from the 100-day MA following a slight dip over the past three sessions.
As a result, the Stochastic Rate of Change (SROC) indicator is moving sideways above the equilibrium level. The indicator lines are green, signaling sustained bullish momentum.
.7000 Price Level" width="1436" height="606" data-lazy-src="https://learn2.trade/wp-content/uploads/2025/04/CRVUSDT_2025-04-16_06-13-48.png"/>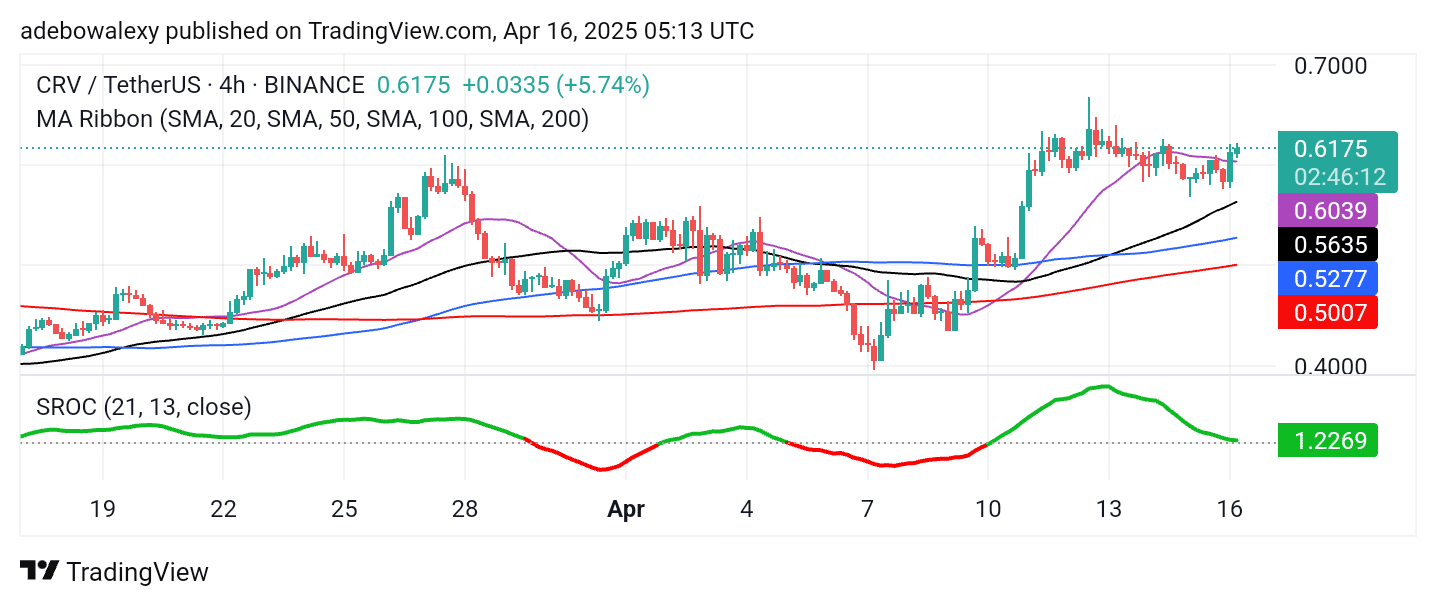
Curve Pushes to Stay in the Green
Bullish pressure in the CRV 4-hour chart continues to show resilience. The new session has started with upward momentum still propelling prices higher. The previous session recorded a more significant price surge, and price action remains above all the MA lines from the daily to the 4-hour chart.
Although the SROC indicator is heading toward the oversold region, it remains green. The lines are starting to turn sideways, indicating that upward forces are still exerting a positive influence on price movement.
Therefore, traders may consider targeting the $0.6500 price level in the short term, with a potential move toward $0.7000 thereafter.
Make money without lifting your fingers: Start trading smarter today
- Broker
- Min Deposit
- Score
- Visit Broker

- Award-winning Cryptocurrency trading platform
- $100 minimum deposit,
- FCA & Cysec regulated

- 20% welcome bonus of upto $10,000
- Minimum deposit $100
- Verify your account before the bonus is credited
- Fund Moneta Markets account with a minimum of $250
- Opt in using the form to claim your 50% deposit bonus
Learn to Trade
Never Miss A Trade Again

Signal Notification
Real-time signal notifications whenever a signal is opened, closes or Updated

Get Alerts
Immediate alerts to your email and mobile phone.

Entry Price Levels
Entry price level for every signal Just choose one of our Top Brokers in the list above to get all this free.