Curve’s price action has corrected upwards today by 6.14%. This happened shortly after price action fell below an eight-month low, which was last visited around December last year (2022). Nevertheless, indications coming from the market suggest that price action is already eying a price resistance level at the $0.500 mark.
Curve Statistics:
CRV Value Now: $0.485
CRV Market Cap: $419,269,332
Curve Circulating Supply: 867,890,051 CRV
Curve Total Supply: 2,002,409,322 CRV
CRV CoinMarketCap Ranking: 77
Major Price Levels:
Top: $0.485, $0.500, and $0.550
Base: $0.450, $0.400, and $0.350
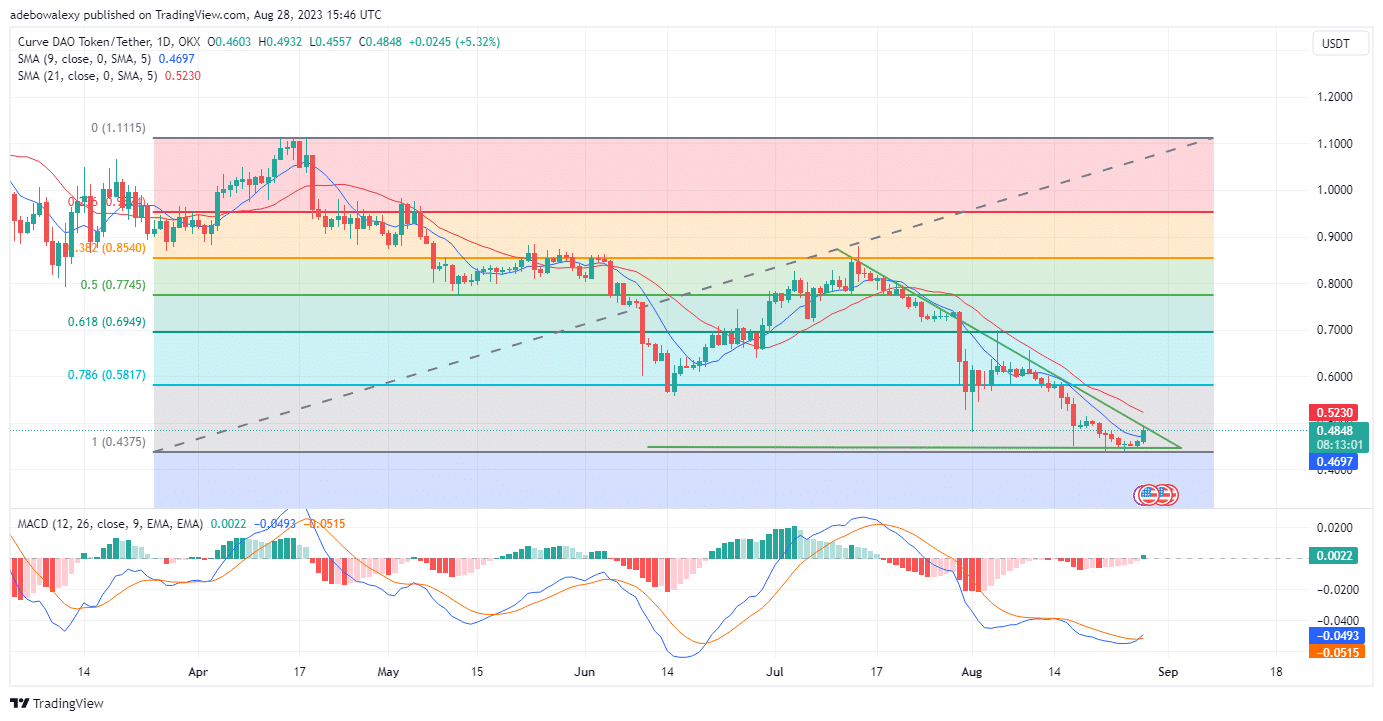
Curve Appears Set to Breakout Toward the $0.500 Resistance
The previous session in the CRVUSDT daily market saw price action bounce off a multi-month low. Subsequently, the ongoing session seems to have significantly advanced the upside correction of the previous session. The last price candlestick on this chart has placed the current price of this token above the 9-day Moving Average (MA).
Meanwhile, the Moving Average Convergence Divergence indicator (MACD) has just performed an upside crossover under the equilibrium level. Additionally, a green bar has just appeared above the equilibrium point of the MACD, which further strengthens the opinion that price action may still increase further.
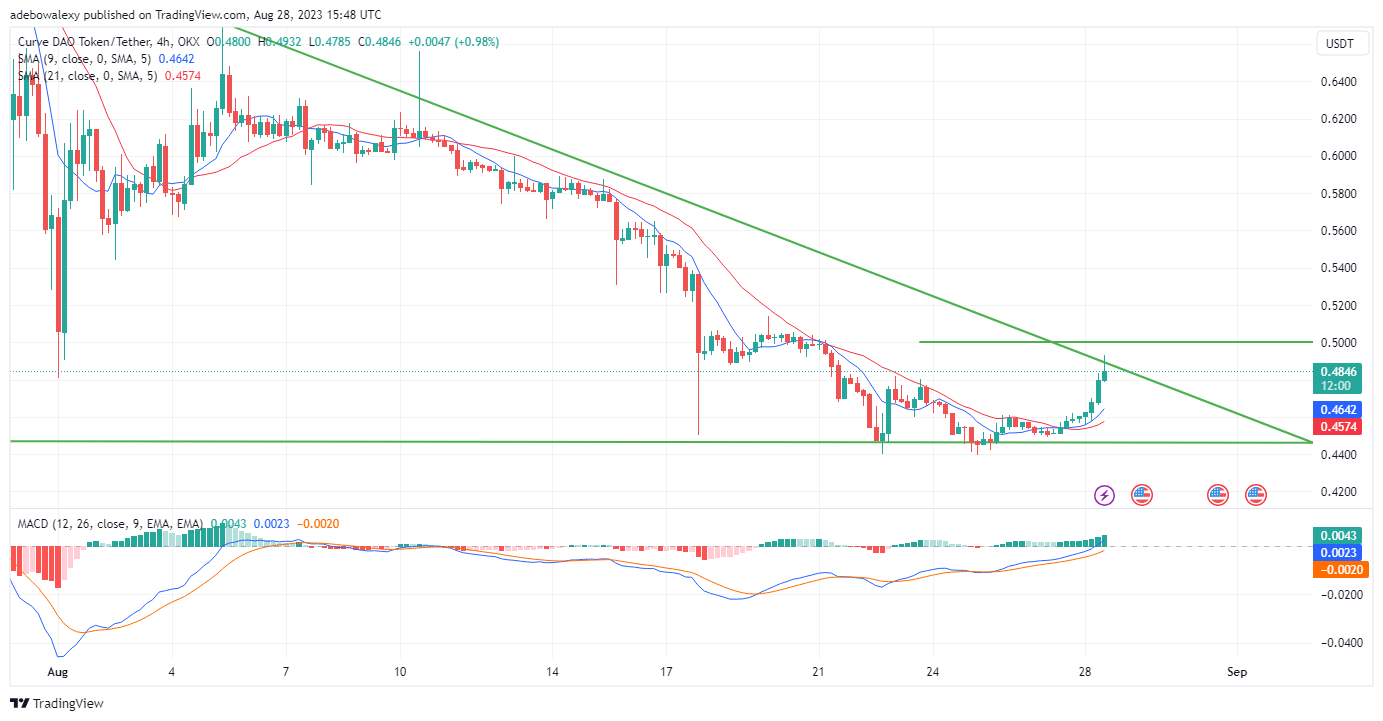
Upside Momentum in the CRV Market Seems Fairly Strong
Considering the behavior of price action in the CRV 4-hour market, it reveals that buyers have consistently gathered moderate profits in the previous trading sessions. The last price candle on this market has its shadow piercing through the ceiling of the falling wedge triangle pattern drawn on this chart.
Trading activities are occurring above the 9- and 21-day MA lines, while the MACD lines continue to rise out of the sub-zero region of the indicator. Also, the bars of the MACD can be seen appearing green and increasing in length. All the inferences drawn from the available technical indicators here indicate that prices may surpass the $0.500 price mark.
- Broker
- Min Deposit
- Score
- Visit Broker

- Award-winning Cryptocurrency trading platform
- $100 minimum deposit,
- FCA & Cysec regulated

- 20% welcome bonus of upto $10,000
- Minimum deposit $100
- Verify your account before the bonus is credited
- Fund Moneta Markets account with a minimum of $250
- Opt in using the form to claim your 50% deposit bonus
Learn to Trade
Never Miss A Trade Again

Signal Notification
Real-time signal notifications whenever a signal is opened, closes or Updated

Get Alerts
Immediate alerts to your email and mobile phone.

Entry Price Levels
Entry price level for every signal Just choose one of our Top Brokers in the list above to get all this free.