Don’t invest unless you’re prepared to lose all the money you invest. This is a high-risk investment and you are unlikely to be protected if something goes wrong. Take 2 minutes to learn more
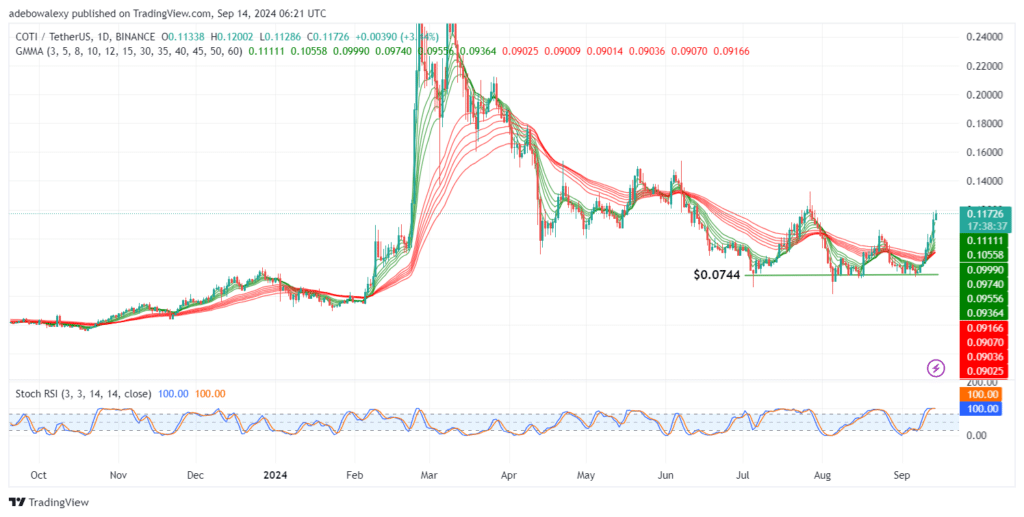
Price activity in the COTIUSDT market found a more stable support level around the $0.0744 mark a few days into July. Although the market has been oscillating around this price level, it appears it has picked up stronger momentum in recent sessions. This has led to a moderate upside correction. Let’s take a closer look at this market.
.0744 Mark" width="580" height="293" data-lazy-src="https://learn2.trade/wp-content/uploads/2024/09/COTIUSDT_2024-09-14_07-21-31_072424-1024x517.png"/>
COTIUSDT Sees a Rejection at the $0.1200 Resistance Level
As earlier noted, the COTI token has seen considerable gains over recent trading sessions. This uninterrupted upside retracement has pushed the price above multiple resistance levels and is now to test the $0.1200 resistance level.
However, the session suggests that price action faces rejection at the $0.1200 resistance, as indicated by the upper shadow on the last price candle. Nevertheless, bulls are still in the lead, and price action is above all the Guppy Multiple Moving Average (GMMA) curves. Additionally, the Stochastic Relative Strength Index (Stochastic RSI) lines can be seen dragging sideways at the 100 mark of the indicator without hinting at a possible reversal.
.0744 Mark" width="580" height="293" data-lazy-src="https://learn2.trade/wp-content/uploads/2024/09/COTIUSDT_2024-09-14_07-21-49_072422-1024x517.png"/>
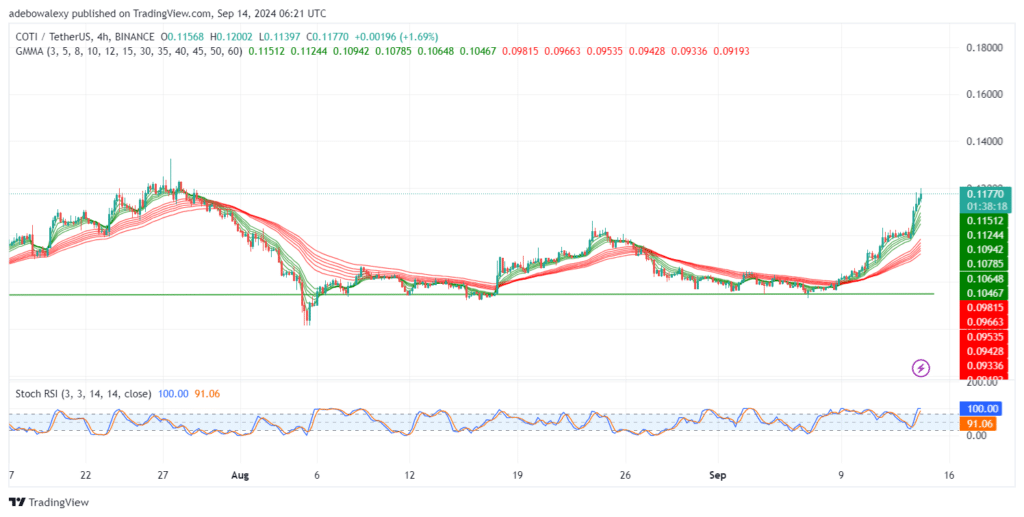
COTI Retains Positive Outlook
Price activity in the COTIUSDT market remains consistent with its bullish characteristics, even on the 4-hour price chart. Similar to what was observed on the daily chart, the last price candle has an upper shadow after testing the $0.1200 resistance level. Furthermore, upside forces remain viable above the GMMA indicator lines.
Meanwhile, the leading line of the Stochastic RSI has reached the 100 level of the indicator and seems ready to drag sideways, allowing upside forces to build further momentum. Consequently, traders can anticipate that price action may attempt to break the resistance at the $0.1200 mark, so crypto signals aiming toward the $0.1300 threshold may still be useful here.
Trade on MT4 with Leverage up to 1:500! Trade on MT4 with Leverage up to 1:500!
X
We use cookies to ensure that we give you the best experience on our website. If you continue to use this site we will assume that you are happy with it.
 .0744 Mark" width="580" height="293" data-lazy-src="https://learn2.trade/wp-content/uploads/2024/09/COTIUSDT_2024-09-14_07-21-31_072424-1024x517.png"/>