$COIN (NASDAQ: COIN) Forecast: July 28
The Coinbase Global (NASDAQ: COIN) market is nearing the end of its low dip movement and is on the verge of a correction phase. If the bulls increase their buying activity and all support levels stay unchanged, the share price may recover and shift upward from the present daily support candle of $386.39. Assuming all existing support holds and the bulls push higher, the price breakout may test the previous high at $405.88, which could likely reach the $415.00 supply trend line, suggesting capital inflow into the asset and growing purchasing pressure.
Key Levels:
Resistance Levels: $405.00, $406.00, $407.00
Support Levels: $398.00, $397.00, $396.00
COIN Long-term Trend: Bullish (Daily Chart)
The $COIN market price may experience an upside reversal after a slight dip in its higher time frame. The stock price is above the supply levels. This indicates a bullish trend.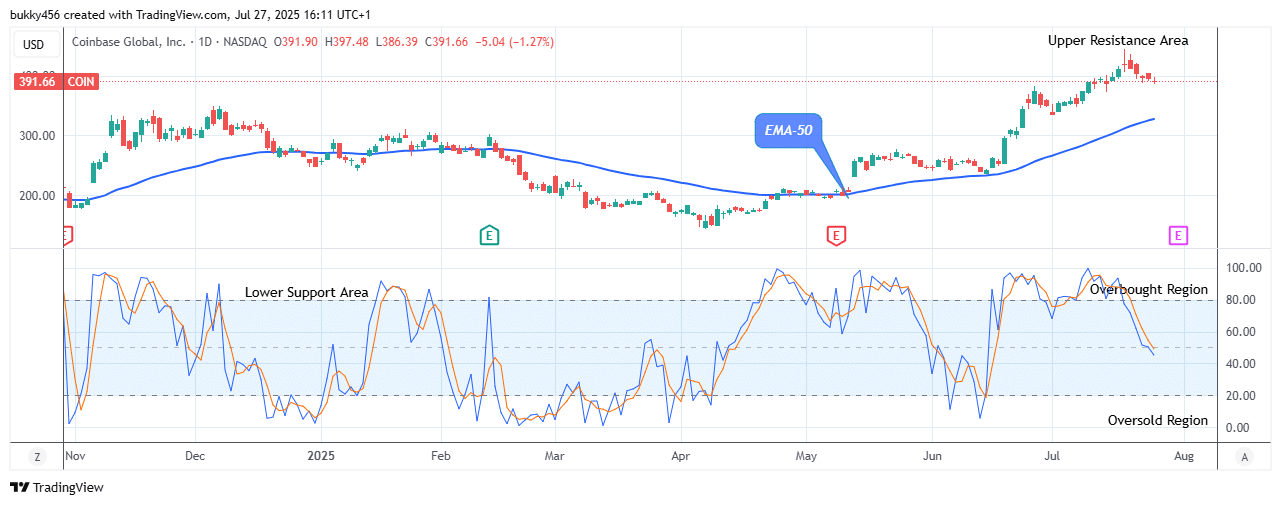
Persistent bullish pressure over the last few hours drove it to a high value of $410.75.
The share price remains in an uptrend. The market is not significantly impacted by the decline in the price of NASDAQ: COIN to the $386.39 low value above the EMA-50 as the daily chart started today.
On the other hand, this permits a more positive impact on the market value. Further, investors may seize the opportunity now and buy the shares for more gains ahead.
If buyers intervene, the selling pressure on the asset may be easing, which might result in a reversal at the $386.39 current support level.
The NASDAQ stock price may therefore be exposed to a $415.00 upper resistance level in the upcoming days if the $405.88 previous high level is touched, indicating continuous buying pressure in the long run.
COIN Medium-term Trend: Bullish (4H Chart)
Despite the bears’ intervention, the NASDAQ: COIN market has a bullish posture and may experience an upside reversal as the bearish pressure is ending soon in the medium-term outlook.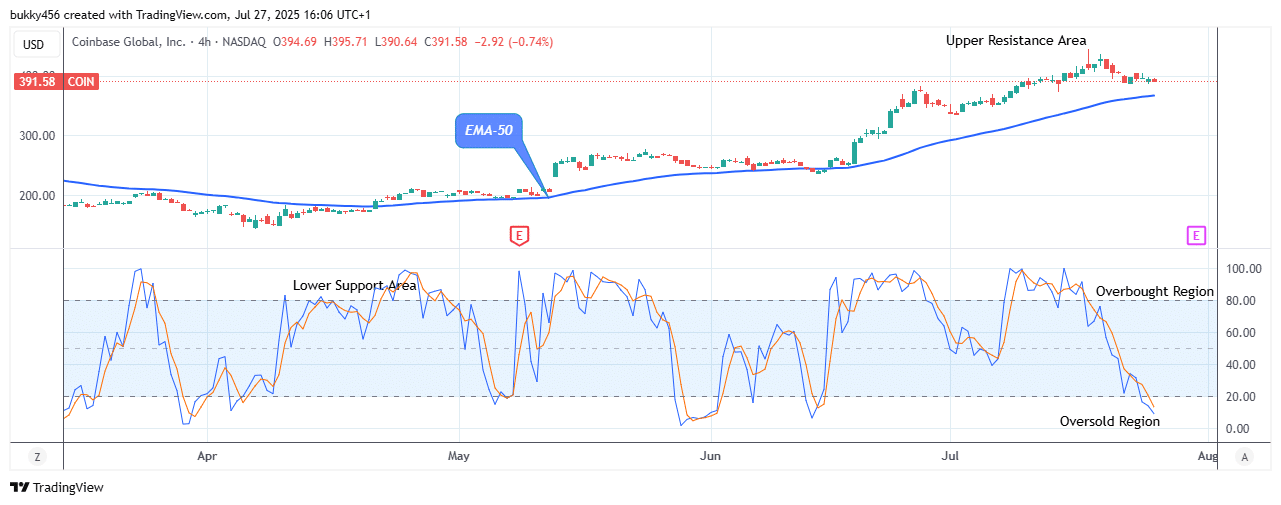
Today, buyers await a bullish opportunity, and the $COIN price remains on the verge of an upside reversal as the short traders drop the stock price to a $390.64 support level above the EMA-50 on the 4-hourly chart.
Hence, should the bulls switch hands with the sell traders and close over the $405.32 resistance point, extra intraday gains will be recorded for the buy investors.
Notably, the NASDAQ stock price has dropped below the daily stochastic 10% range. It shows that the pair is currently in the market’s oversold area, suggesting the selling pressure is likely to run to an end soon.
As a result, the share price could surge to hit $436.30 resistance value soon in its medium-term outlook.
Make money without lifting your fingers: Start trading smarter today
- Broker
- Min Deposit
- Score
- Visit Broker

- Award-winning Cryptocurrency trading platform
- $100 minimum deposit,
- FCA & Cysec regulated

- 20% welcome bonus of upto $10,000
- Minimum deposit $100
- Verify your account before the bonus is credited
- Fund Moneta Markets account with a minimum of $250
- Opt in using the form to claim your 50% deposit bonus
Learn to Trade
Never Miss A Trade Again

Signal Notification
Real-time signal notifications whenever a signal is opened, closes or Updated

Get Alerts
Immediate alerts to your email and mobile phone.

Entry Price Levels
Entry price level for every signal Just choose one of our Top Brokers in the list above to get all this free.