$COIN (NASDQ: COIN) Forecast: December 31
The $COIN price can grow more and see a significant increase if investors and analysts continue to show keen interest in the share market. The price is facing resistance and may continue with the new correction, provided buyers don’t give up and increase their momentum pressure in the market. As demand for the NASDAQ stock platform continues to soar, an aggressive push from the current price of $236.06, which is above the supply trend levels, will put the share in a more bullish trend and may reach the $405.88 upper resistance level, resulting in a significant price surge amid renewed buying momentum.
Key Levels:
Resistance Levels: $298.00, $299.00, $300.00
Support Levels: $165.00, $164.00, $163.00
$COIN Long-term Trend: Bearish (Daily Chart)
Due to mutual growth in market expansion, the $COIN price could increase as it begins a new correction, but it is yet to reach its goals on the higher time frame. 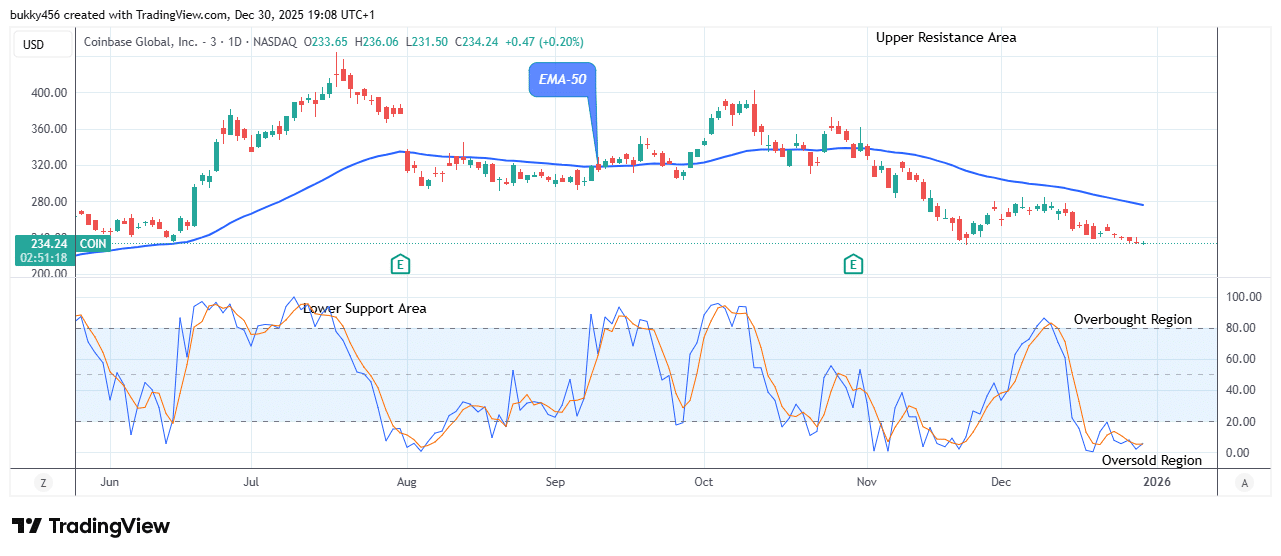
The recent bearish momentum has been influenced by short-term traders’ interference at the $232.78 low level in the prior action.
At the time of writing, the NASDAQ:COIN market is poised to surge as the bulls caused a rise to a $236.06 resistance level close to the EMA-50 on the daily chart.
Thus, traders who buy the shares during the bearish market will also make gains in the future.
However, as we are witnessing a fresh bullish correction, the $COIN price may continue to rise.
Therefore, a large potential rally for buyers may occur if the price can hold above the $392.16 high level and reach a substantial level at the upper channel.
Additionally, the daily stochastic indicates an uptrend. If the bulls can maintain the share price above the previous high, the ensuing rally may surpass the $392.16 level and reach the $405.00 psychological mark at the upside in the next days.
$COIN Medium-term Trend: Bearish (4H Chart)
The NASDAQ: COIN price is currently trading in the bearish market zone, due to the interaction from sell traders.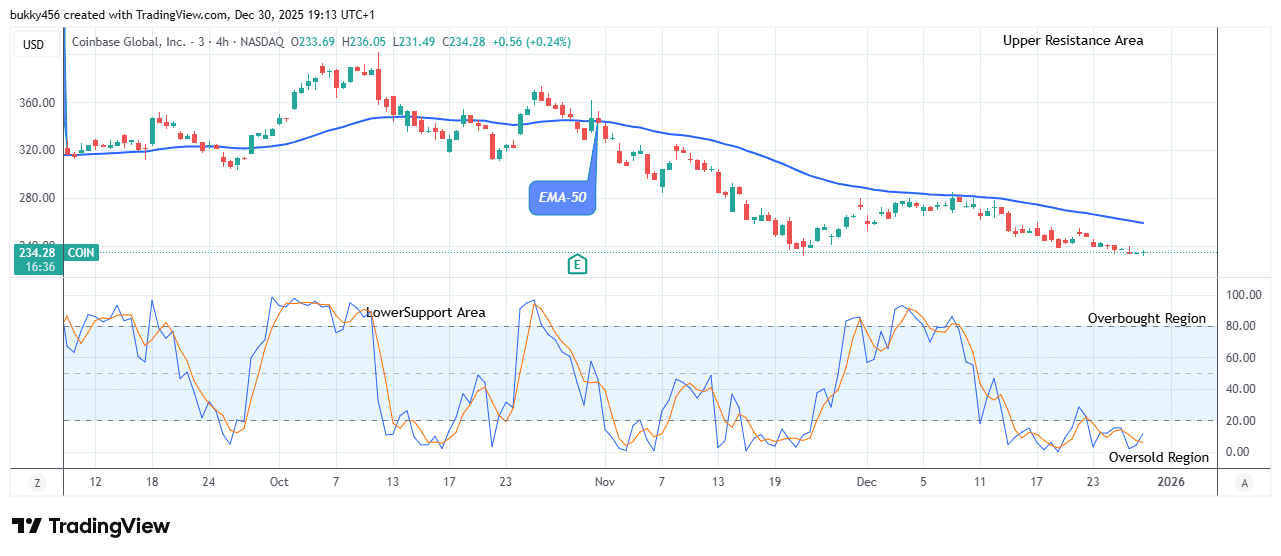
The $COIN price at the $236.05 supply mark below the moving average shortly after the 4-hourly chart opens today is a pullback by the bulls, indicating investors’ interest and confidence in the asset.
Hence, if buying pressure increases, the stock price may surge to retest the previous high of $389.56, gaining a stronger foundation for further growth.
Similarly, pointing up at the oversold region as indicated by the price projector suggests a high possibility of bullish continuation.
In light of this, if additional selling momentum is prevented, a post-retest rally may drive NASDAQ stock prices high to hit the upper resistance level of $405.00 soon in its medium-term time frame.
Trade your favorite stocks using a premium broker. Open an account here
- Broker
- Min Deposit
- Score
- Visit Broker

- Award-winning Cryptocurrency trading platform
- $100 minimum deposit,
- FCA & Cysec regulated

- 20% welcome bonus of upto $10,000
- Minimum deposit $100
- Verify your account before the bonus is credited
- Fund Moneta Markets account with a minimum of $250
- Opt in using the form to claim your 50% deposit bonus
Learn to Trade
Never Miss A Trade Again

Signal Notification
Real-time signal notifications whenever a signal is opened, closes or Updated

Get Alerts
Immediate alerts to your email and mobile phone.

Entry Price Levels
Entry price level for every signal Just choose one of our Top Brokers in the list above to get all this free.