Key Support Zones: $7, 000, $6, 000, $5,000
BTC/USD Long-term Trend: Bullish
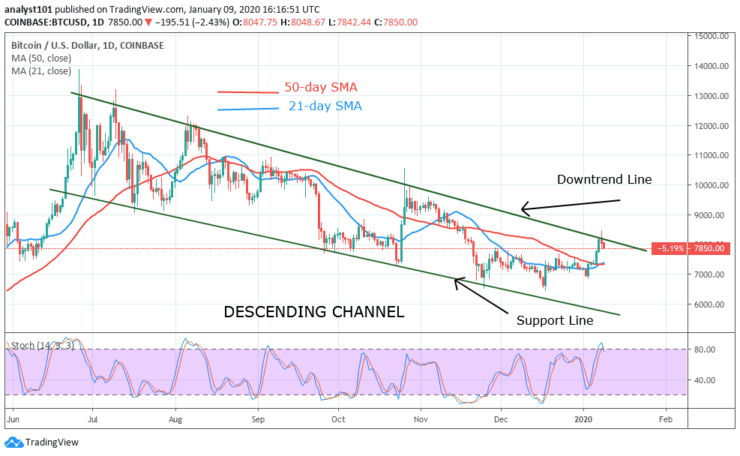
Interestingly, the bulls broke the resistance levels of $7,600 and $7,800. In the previous analysis, we had anticipated that Bitcoin may rise to a high of $9,200 if the overhead resistance was broken. The price action has completed one aspect of the analysis. The second aspect is the target of $9,200. The bulls rose to a high of $8,400 but were resisted.
Bitcoin is retracing to a low of $7,800. On the upside, if the current support holds, the price will rally above $9,200. Nevertheless, subsequent bullish move at the initial target will catapult Bitcoin to the high of $10,300 . On the downside, if the bulls fail to defend the $7,800 support level, which is unlikely, it is a sign of weakness.

Daily Chart Indicators Reading:
The stochastic is approaching the overbought area of the market. The bands were initially above 80% range but are making are u-turn below the range. The coin is in bullish momentum. The most important aspect of the price is that it broke the downtrend line but retraced back to the support of $7,800. However, if the bulls had broken the trend line and the price closed above it, then the uptrend will resume.
BTC/USD Medium-term bias: Bullish
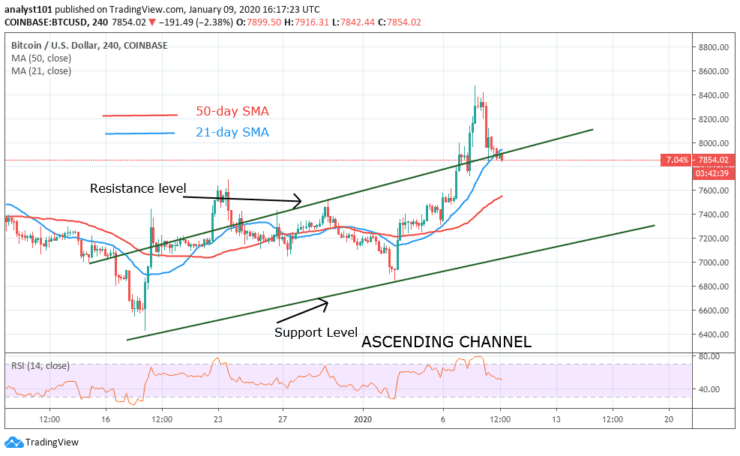
On the 4 hour chart, the market was trading below the first resistance at $7,600. Below the first resistance, Bitcoin traded for about a month before the eventual breakout. On January 3, the market fell to a low of $6,800 and commenced a bullish move. The price reached a high of $8,400 but it is currently retracing.
4-hour Chart Indicators Reading
The price retraced to the support of the 21-day SMA or above the resistance line. The implication is that if the support holds, Bitcoin will rise and retest the $8,400 and move to the $10,300 price level. The 21-day SMA and the 50-day SMA are pointing northward indicating the uptrend.
General Outlook for Bitcoin (BTC)
Bitcoin has shown strength as it pulled through the resistance levels. On the 4-hour chart, the price fell to the support of the 21-day SMA and holds. This is a signal that the market will rise. A bullish candlestick has shown below countering the downward move.
BTC Trade Signal
Instrument: BTC/USD
Order: Buy
Entry price: $7,800
Stop: $7,000
Target: $10,300
- Broker
- Min Deposit
- Score
- Visit Broker
- Award-winning Cryptocurrency trading platform
- $100 minimum deposit,
- FCA & Cysec regulated
- 20% welcome bonus of upto $10,000
- Minimum deposit $100
- Verify your account before the bonus is credited
- Fund Moneta Markets account with a minimum of $250
- Opt in using the form to claim your 50% deposit bonus
Learn to Trade
Never Miss A Trade Again

Signal Notification
Real-time signal notifications whenever a signal is opened, closes or Updated

Get Alerts
Immediate alerts to your email and mobile phone.

Entry Price Levels
Entry price level for every signal Just choose one of our Top Brokers in the list above to get all this free.


