Key Highlights
LINK faces rejection at $9.50 resistance
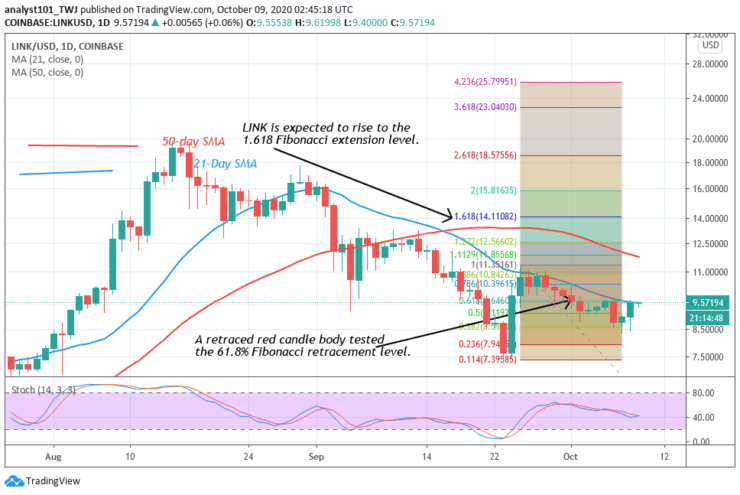
The crypto may rise and reach a high of $14.11
Chainlink (LINK) Current Statistics
The current price: $9.52
Market Capitalization: $3,330,369,672
Trading Volume: $1,484,847,104
Major supply zones: $18.00, $20.00, $22.00
Major demand zones: $8.00, $6.00, $4.00
Chainlink (LINK) Price Analysis October 9, 2020
LINK has been making a consistent downward move since August 15. The coin has been making a series of lower highs and lower lows. After making lower lows to the support at $8.50, the coin rebounded. The recent rebound took the coin to the high of $9.50. LINK is expected to make a further upward move. The coin will resume upside momentum if buyers push the price above $14 high. However, the coin risks another downward move if it fails to break the current resistance at $9.50.
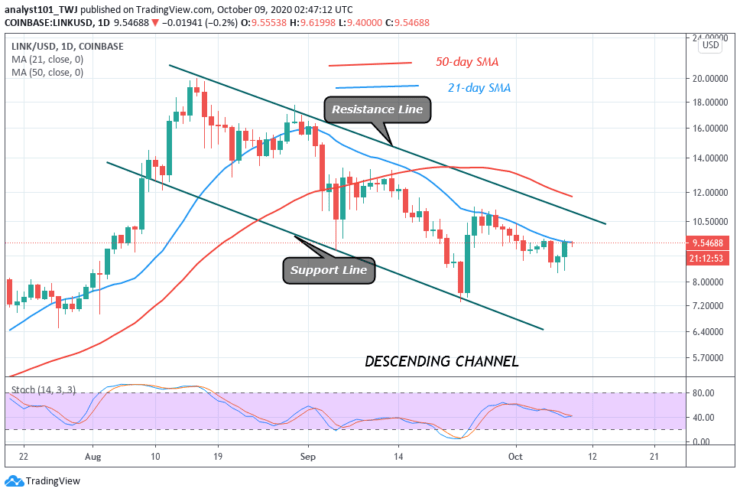
Chainlink Technical Indicators Reading
LINK price is trading below the SMAs. This suggests that the coin may fall. A break above the SMAs will mean an upward movement of the coin. The crypto is also below the 50% range of the daily stochastic. It means that the coin is in a bearish momentum.
Conclusion
LINK is likely to make an upward move once the current resistance is broken. On September 25 uptrend; the coin was resisted at $11. The retraced red candle body tested the 61.8% Fibonacci retracement level. It indicates that LINK will rise and reach level 1.618 Fibonacci extension or the high of $14.11.
Note: Learn2.Trade is not a financial advisor. Do your research before investing your funds in any financial asset or presented product or event. We are not responsible for your investing results
- Broker
- Min Deposit
- Score
- Visit Broker

- Award-winning Cryptocurrency trading platform
- $100 minimum deposit,
- FCA & Cysec regulated

- 20% welcome bonus of upto $10,000
- Minimum deposit $100
- Verify your account before the bonus is credited
- Fund Moneta Markets account with a minimum of $250
- Opt in using the form to claim your 50% deposit bonus
Learn to Trade
Never Miss A Trade Again

Signal Notification
Real-time signal notifications whenever a signal is opened, closes or Updated

Get Alerts
Immediate alerts to your email and mobile phone.

Entry Price Levels
Entry price level for every signal Just choose one of our Top Brokers in the list above to get all this free.