Key Highlights
LINK resumes a downward move
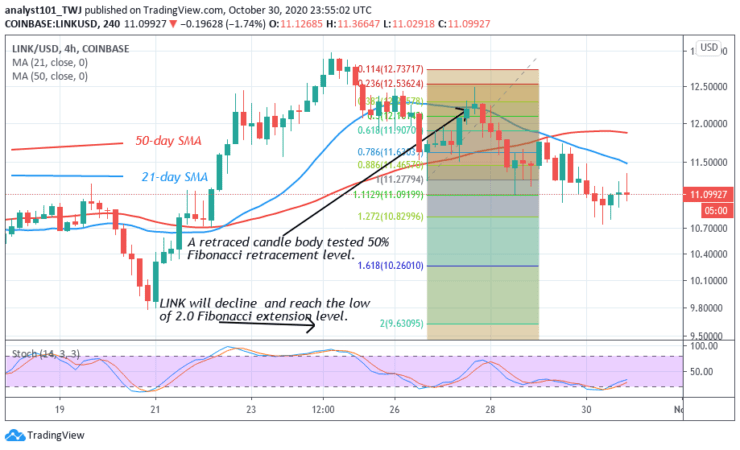
The crypto is likely to reach a low of $9. 63
Chainlink (LINK) Current Statistics
The current price: $11.14
Market Capitalization: $4,351,047,564
Trading Volume: $1,670,028,120
Major supply zones: $18.00, $20.00, $22.00
Major demand zones: $8.00, $6.00, $4.00
Chainlink (LINK) Price Analysis October 31, 2020
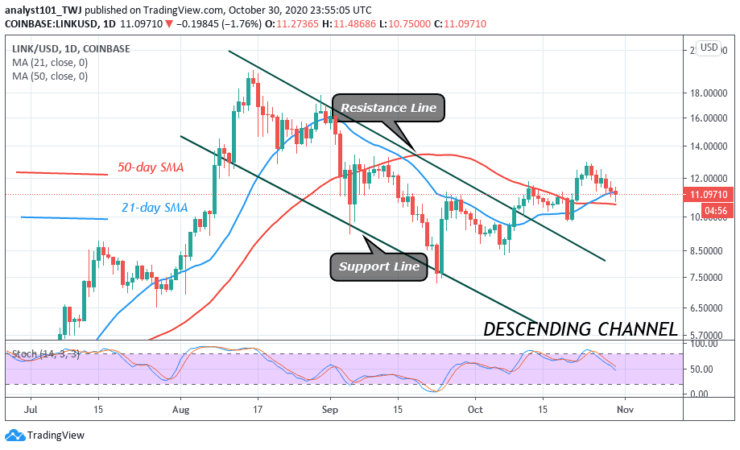
LINK price is making a series of lower highs and lower lows. The crypto is in a downtrend as price makes a downward move. Today, the price is retracing after rejection from the recent high. Presently, the market is falling as price breaks below the SMAs. A break below the SMAs will increase the chances of a downward move. Conversely, if the 21-day and 50-day SMAs support hold, the XRP will resume an upward move. In the meantime, the market is falling.
Chainlink Technical Indicators Reading
LINK price has since broken the resistance of the descending channel. The coin is below the 80% range of the daily stochastic. It indicates that the market is in bearish momentum.
Conclusion
From the price action, LINK is likely to make a further downward move. On October 26, a retraced candle body tested a 50% Fibonacci retracement level. It indicates that LINK will decline and reach a low of 2.0 Fibonacci extension level. In other words, the market will reach a level of $9.63 low.
Note: Learn2.Trade is not a financial advisor. Do your research before investing your funds in any financial asset or presented product or event. We are not responsible for your investing results
- Broker
- Min Deposit
- Score
- Visit Broker

- Award-winning Cryptocurrency trading platform
- $100 minimum deposit,
- FCA & Cysec regulated

- 20% welcome bonus of upto $10,000
- Minimum deposit $100
- Verify your account before the bonus is credited
- Fund Moneta Markets account with a minimum of $250
- Opt in using the form to claim your 50% deposit bonus
Learn to Trade
Never Miss A Trade Again

Signal Notification
Real-time signal notifications whenever a signal is opened, closes or Updated

Get Alerts
Immediate alerts to your email and mobile phone.

Entry Price Levels
Entry price level for every signal Just choose one of our Top Brokers in the list above to get all this free.