Key Highlights
LINK faces another rejection at $11.81 as it resumes downtrend
LINK may slump to level $9.33
Chainlink (LINK) Current Statistics
The current price: $10.50
Market Capitalization: $3,673,518,965
Trading Volume: $1,213,763,942
Major supply zones: $18.00, $20.00, $22.00
Major demand zones: $8.00, $6.00, $4.00
Chainlink (LINK) Price Analysis October 16, 2020
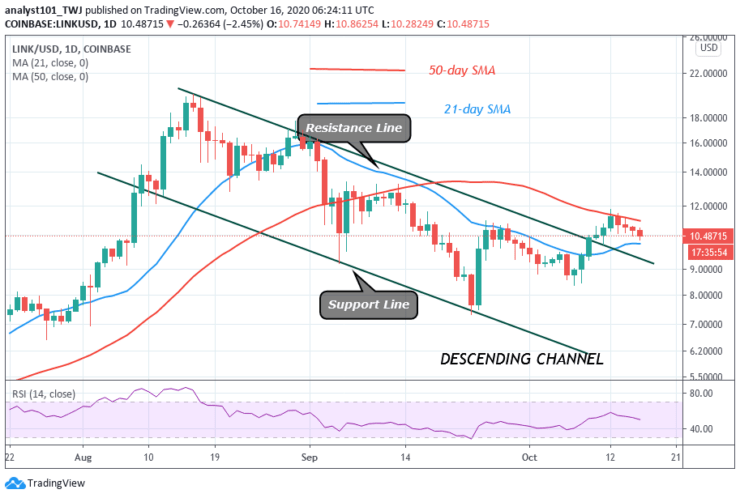
LINK downtrend was partially interrupted on October 7, when the coin rebounded to reach the high of $11.81. However, the bulls fail to sustain the upward move. LINK would have been out of the downward correction if buyers have pushed the coin above the $14 high. The coin has resumed a downward move after rejection from the high of $11.81. The market will further decline if the price breaks below the SMAs. Today, the crypto is trading at $10.38 at the time of writing.
Chainlink Technical Indicators Reading
LINK price breaks the 21-day SMA but faces rejection at the 50-day SMA. There is a likelihood of price falling. The coin has fallen to level 49 of the Relative Strength Index period 14. This implies that there is a balance between supply and demand.
Conclusion
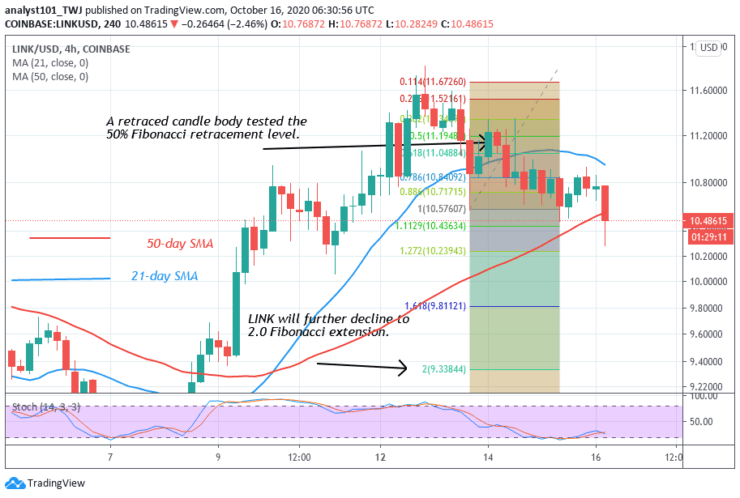
LINK is falling after rejection from $11.81. There will be a further decline if the $10.20 support cracks. On October 13 downtrend; the retraced candle body tested the 50% Fibonacci retracement level. It implies that the selling pressure will continue to level 2.0 Fibonacci extension or the low of $9.33.
Note: Learn2.Trade is not a financial advisor. Do your research before investing your funds in any financial asset or presented product or event. We are not responsible for your investing results
- Broker
- Min Deposit
- Score
- Visit Broker

- Award-winning Cryptocurrency trading platform
- $100 minimum deposit,
- FCA & Cysec regulated

- 20% welcome bonus of upto $10,000
- Minimum deposit $100
- Verify your account before the bonus is credited
- Fund Moneta Markets account with a minimum of $250
- Opt in using the form to claim your 50% deposit bonus
Learn to Trade
Never Miss A Trade Again

Signal Notification
Real-time signal notifications whenever a signal is opened, closes or Updated

Get Alerts
Immediate alerts to your email and mobile phone.

Entry Price Levels
Entry price level for every signal Just choose one of our Top Brokers in the list above to get all this free.