Key Highlights
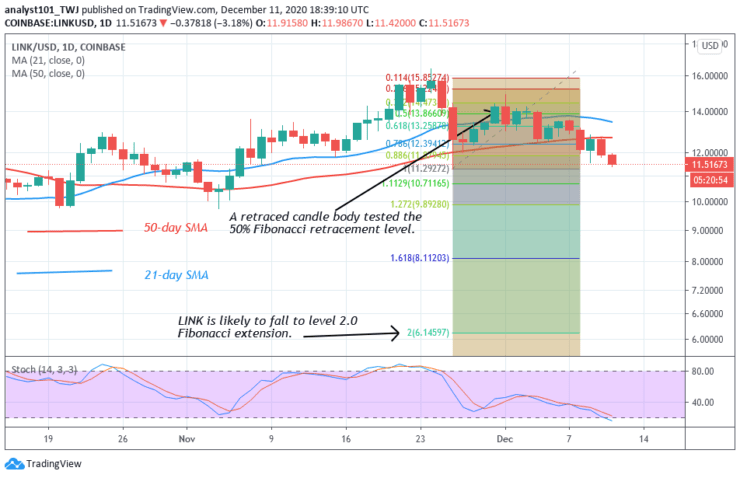
LINK risks further decline to $6.14 low
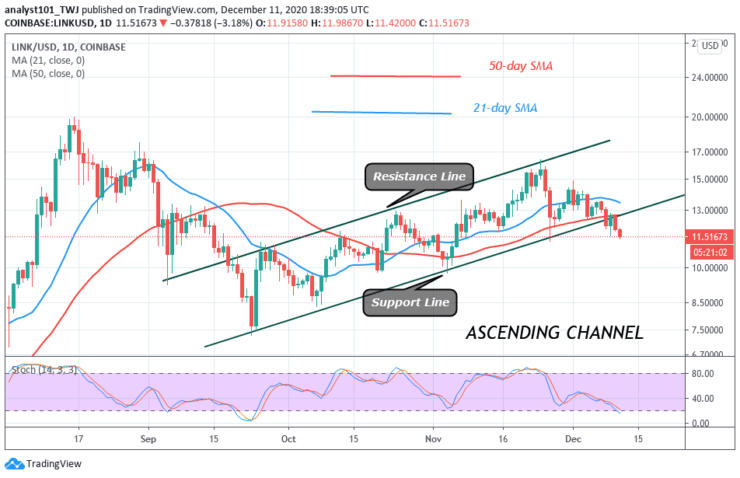
The coin faces rejection from the recent high of $16
Chainlink (LINK) Current Statistics
The current price: $11.67
Market Capitalization: $4,625,555,54
Trading Volume: $988,347,716
Major supply zones: $18.00, $20.00, $22.00
Major demand zones: $8.00, $6.00, $4.00
Chainlink (LINK) Price Analysis December 11, 2020
Following its rejection at the $16 overhead resistance, LINK plunged to an $11.10 low. The bulls buy the dips and corrected upward. The upward correction was terminated at $14.50 as the coin resumed a downward move. On the 4 –hour chart, the coin is making a series of lower highs and lower lows. LINK is likely to further depreciate as the price breaks below the SMAs. The crypto is falling as it retests the previous low at $9.50.
Chainlink Technical Indicators Reading
The price has broken below the SMAs which suggests that the coin will fall. Also, the price also broke below the support which signals a change in the trend. LINK is below 25% range of the daily stochastic. It indicates that the coin is in the bearish trend zone.
Conclusion
From the price action, there is a certainty that the coin will further decline. On November 26 downtrend, the retraced candle body tested the 50% Fibonacci retracement level. The retracement indicates that the coin will fall at level 2.0 Fibonacci extension level. That is the crypto will reach the low of $6.14.
Note: Learn2.Trade is not a financial advisor. Do your research before investing your funds in any financial asset or presented product or event. We are not responsible for your investing results
- Broker
- Min Deposit
- Score
- Visit Broker

- Award-winning Cryptocurrency trading platform
- $100 minimum deposit,
- FCA & Cysec regulated

- 20% welcome bonus of upto $10,000
- Minimum deposit $100
- Verify your account before the bonus is credited
- Fund Moneta Markets account with a minimum of $250
- Opt in using the form to claim your 50% deposit bonus
Learn to Trade
Never Miss A Trade Again

Signal Notification
Real-time signal notifications whenever a signal is opened, closes or Updated

Get Alerts
Immediate alerts to your email and mobile phone.

Entry Price Levels
Entry price level for every signal Just choose one of our Top Brokers in the list above to get all this free.