Don’t invest unless you’re prepared to lose all the money you invest. This is a high-risk investment and you are unlikely to be protected if something goes wrong. Take 2 minutes to learn more
Chainlink’s price has only moved by 1.48%, but its price action seems to have found a more elevated support level.
Consequently, this has considerably increased the pace of price upside retracement. Let’s further examine this market for better judgment.
LINK Statistics
Chainlink Value Now: $7.94
LINK Market Cap: $4,261,847,835
LINK Circulating Supply: 538,099,970
Chainlink Total Supply: 1,000,000,000
Chainlink CoinMarketCap Ranking: 21
Major Price Levels:
Top: $7.94, $8.50, and $9.00
Base: $7.50, $7.00, and $6.50
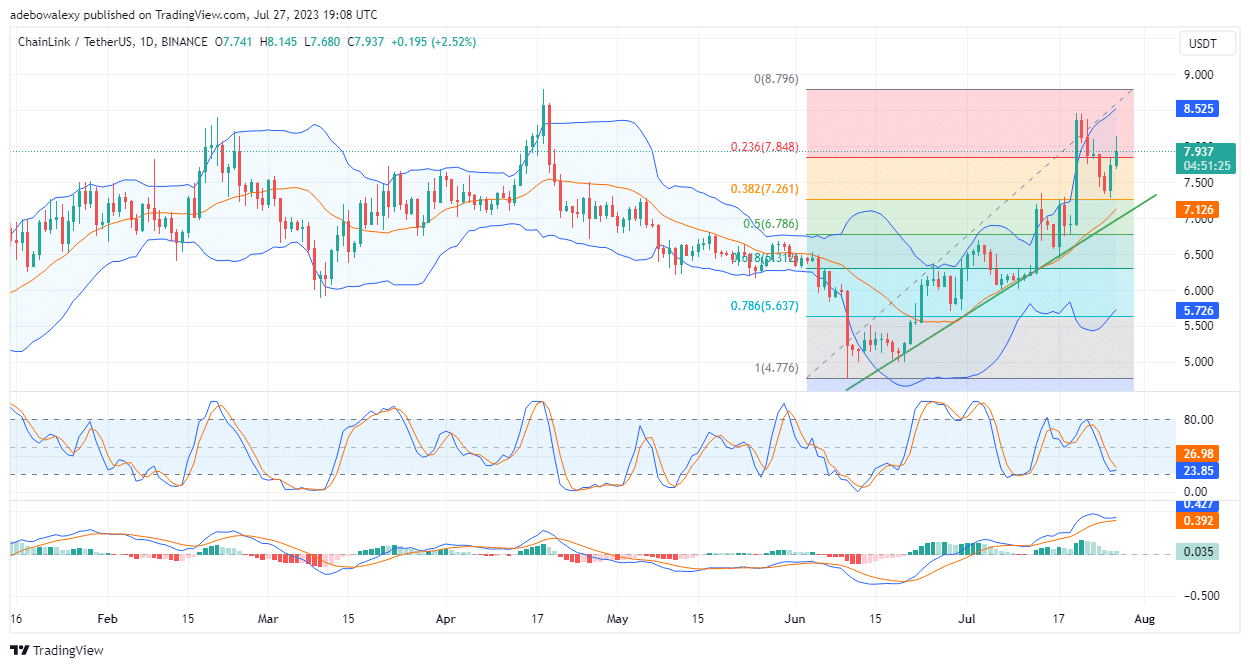
Chainlink Price Action Seems to Have Acquired a Higher Base
On the Chainlink daily chart, it could be seen that price action about seven trading sessions ago burst through the price ceiling at $8.00 as expected. But the reaction to this was a sharp downward correction in prices.
However, buyers were able to abate the downside correction not too much below the $7.50 price mark. Consequently, this suggests that price action may have found strong support here, as price action has extended the upside retracement for the second trading session.
Going by the Bollinger Bands, it appears that volatility is high in this market. Additionally, the Stochastic Relative Strength Index indicator continues to approach a bullish crossover. This may offer more upside traction if eventually achieved.
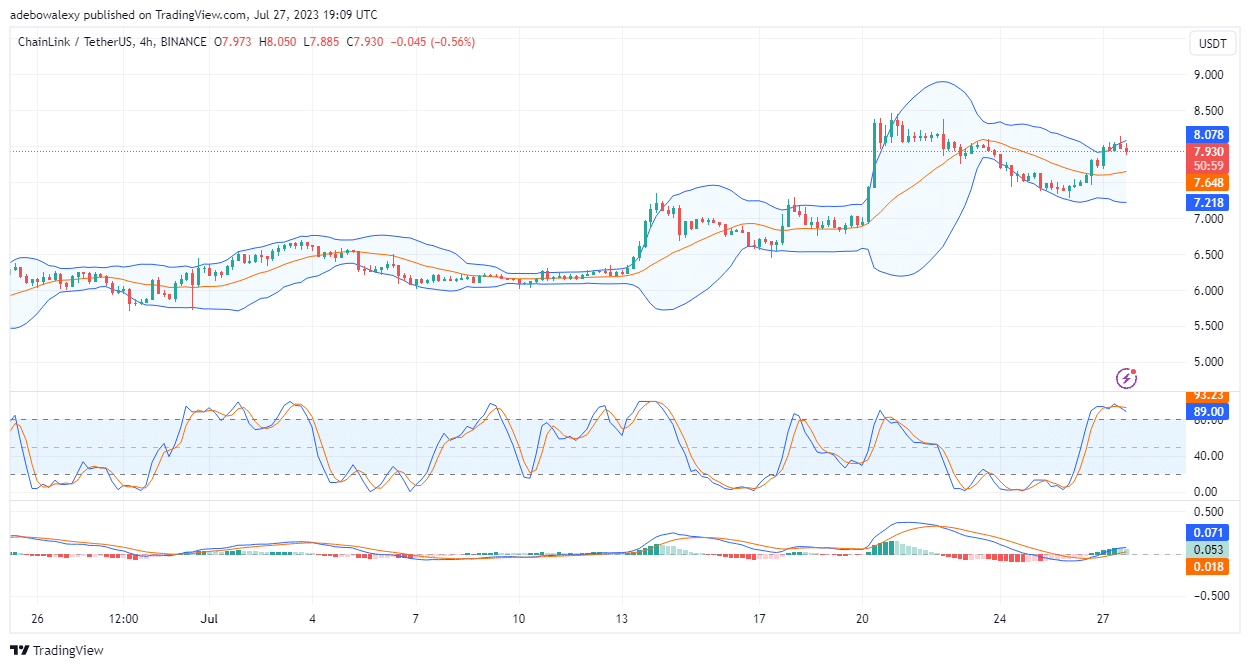
LINK Corrects Off the $8.00 Mark
The LINK/USDT 4-hour chart reveals that price action has minimally corrected off the $8.00 price mark very recently. Nevertheless, price action remains significantly above the middle limit of the Bollinger Bands indicator.
Also, here, it appears that volatility is moderate. Meanwhile, the Moving Average Convergence Divergence (MACD) indicator lines have crossed above the equilibrium level. Although the bars of this indicator are now pale green, which indicates that buyers may be exiting.
Also, the Stochastic RSI indicator lines are now trending somewhat sideways. Consequently, this suggests that the perceived correction may be transient. Yet, traders should exercise caution in their prediction of a price retracement towards the $9.00 mark.
- Broker
- Min Deposit
- Score
- Visit Broker

- Award-winning Cryptocurrency trading platform
- $100 minimum deposit,
- FCA & Cysec regulated

- 20% welcome bonus of upto $10,000
- Minimum deposit $100
- Verify your account before the bonus is credited
- Fund Moneta Markets account with a minimum of $250
- Opt in using the form to claim your 50% deposit bonus
Learn to Trade
Never Miss A Trade Again

Signal Notification
Real-time signal notifications whenever a signal is opened, closes or Updated

Get Alerts
Immediate alerts to your email and mobile phone.

Entry Price Levels
Entry price level for every signal Just choose one of our Top Brokers in the list above to get all this free.