Don’t invest unless you’re prepared to lose all the money you invest. This is a high-risk investment and you are unlikely to be protected if something goes wrong. Take 2 minutes to learn more
Price action in the Cartesi market has experienced a notable tailwind in the daily market, but headwinds have become active, pushing back against price movements and causing a significant decline. Nevertheless, bullish traders remain well-positioned to regain significant upside traction.
Key CTSI Statistics:
Current Cartesi value: $0.2336
Cartesi Market Cap: $179,024,912
CTSI’s Circulating Supply: 1,000,000,000
CTSI’s Total Supply: 1,000,000,000
Cartesi CoinMarketCap Ranking: 249
Key Price Levels:
Resistance: $0.2336, $0.2400, and $0.2500
Support: $0.2300, $0.2200, and $0.2100
 .2600 Resistance" width="580" height="331" data-lazy-src="https://learn2.trade/wp-content/uploads/2024/01/CTSIUSDT_2024-01-05_16-25-37-1024x585.png"/>
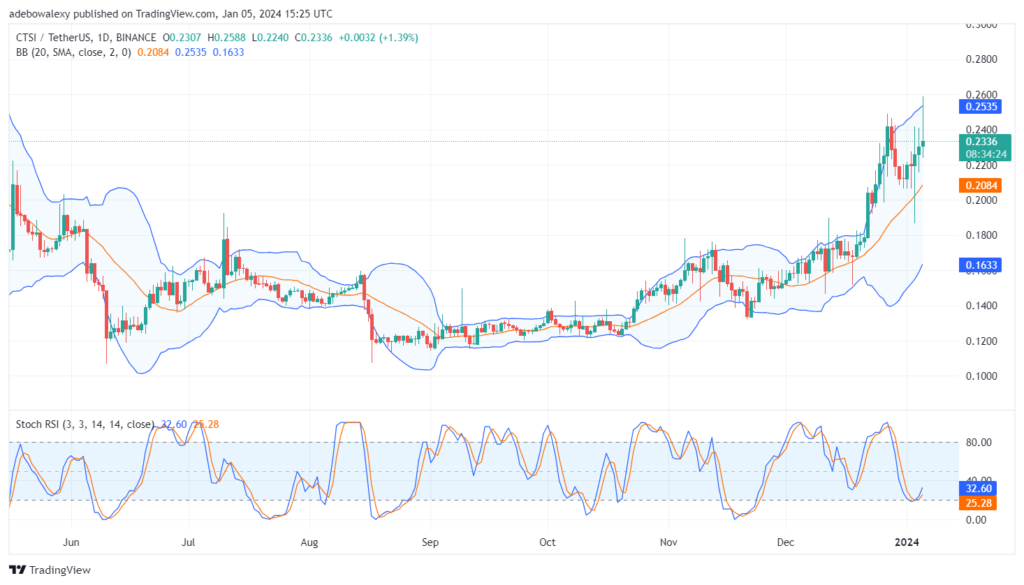
Cartesi Relinquishes a Large Part of Its Gathered Intraday Profits
The behavior of price action in the Cartesi daily market reveals that headwinds have caused a significant loss of profits for traders holding this token as of today. The corresponding price candle for today’s trading session shows its body contracting downward after testing the $0.2600 resistance. However, looking at price movements over the past four trading sessions, it appears that the market still maintains an upward trajectory.
Another point supporting this opinion is that trading activities are still occurring above the middle band of the Bollinger indicator. Examining the arrangement of price candles for the past four sessions reveals an upside orientation, suggesting that despite the downward correction, price activities still appear progressive. Additionally, the Relative Strength Index (RSI) indicator lines maintain a smooth upside trajectory despite the significant price contraction, implying that price movements may continue on an upward path.
.2600 Resistance" width="580" height="331" data-lazy-src="https://learn2.trade/wp-content/uploads/2024/01/CTSIUSDT_2024-01-05_16-25-55-1024x585.png"/>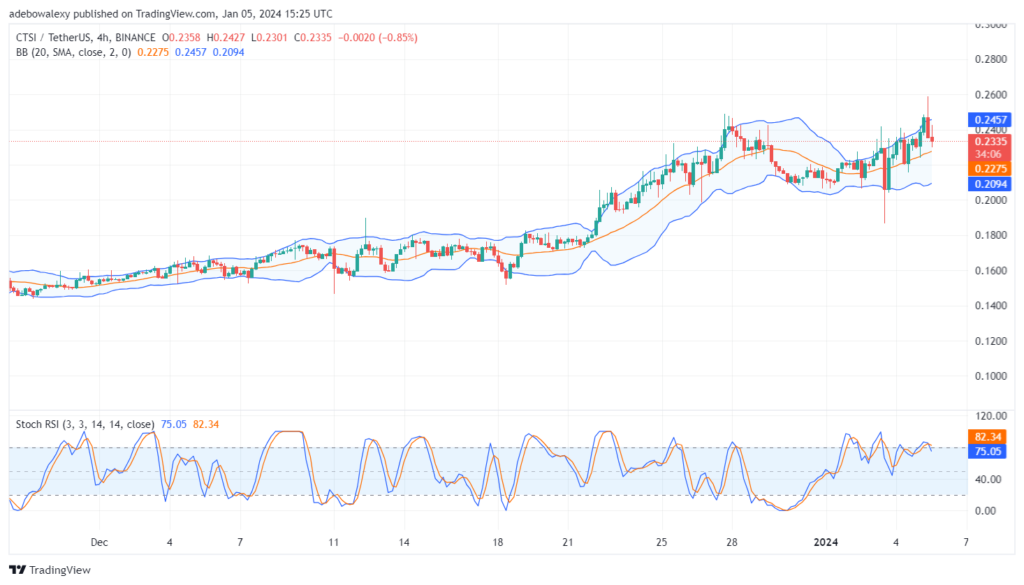
Downward Forces Are Pushing CTSI Hard Against Nearby Support
The CTSI 4-hour market provides a closer view of price developments. It reveals that price action had earlier pushed against the uppermost limit of the Bollinger Bands about three sessions ago. According to the operation of the Bollinger Bands, such a push is likely to result in a significant downward rebound. The said downward rebound occurred over the past session until now.
It should be noted that the downward correction has slowed down above the middle band of the Bollinger Bands, signaling that bulls may still regain momentum. Meanwhile, the RSI indicator lines have delivered a bearish crossover above the 70 marks, effectively dampening hopes of a possible spontaneous rebound. Therefore, if the downward correction persists, traders can target the $0.2275 mark for a potential upside rebound.
Trade crypto coins on AvaTrade
- Broker
- Min Deposit
- Score
- Visit Broker

- Award-winning Cryptocurrency trading platform
- $100 minimum deposit,
- FCA & Cysec regulated

- 20% welcome bonus of upto $10,000
- Minimum deposit $100
- Verify your account before the bonus is credited
- Fund Moneta Markets account with a minimum of $250
- Opt in using the form to claim your 50% deposit bonus
Learn to Trade
Never Miss A Trade Again

Signal Notification
Real-time signal notifications whenever a signal is opened, closes or Updated

Get Alerts
Immediate alerts to your email and mobile phone.

Entry Price Levels
Entry price level for every signal Just choose one of our Top Brokers in the list above to get all this free.