Don’t invest unless you’re prepared to lose all the money you invest. This is a high-risk investment and you are unlikely to be protected if something goes wrong. Take 2 minutes to learn more
Price action in the CTSIUSD market had earlier charged towards the $0.2600 price mark. However, there was a few headwind activities on the way, which caused a price retracement toward the $0.2380 price mark. At this point, it appears as if buyers have renewed their strength and are now ready to once again challenge the resistance at $0.2600.
Cartesi Analysis Data
CTSI value now: $0.2446
CSTI Protocol Market Cap: $173,751,999
Cartesi Moving Supply: 698,800,024
CTSI Total Supply: 1,000,000,000
CTSI CoinMarketCap ranking: 179
Major Price Levels:
Top: $0.2446, $0.2486, and $0.2500
Base: $0.2406, $0.2386, and $0.2346

Cartesi (CTSI) Are Showing Signs of Weakness
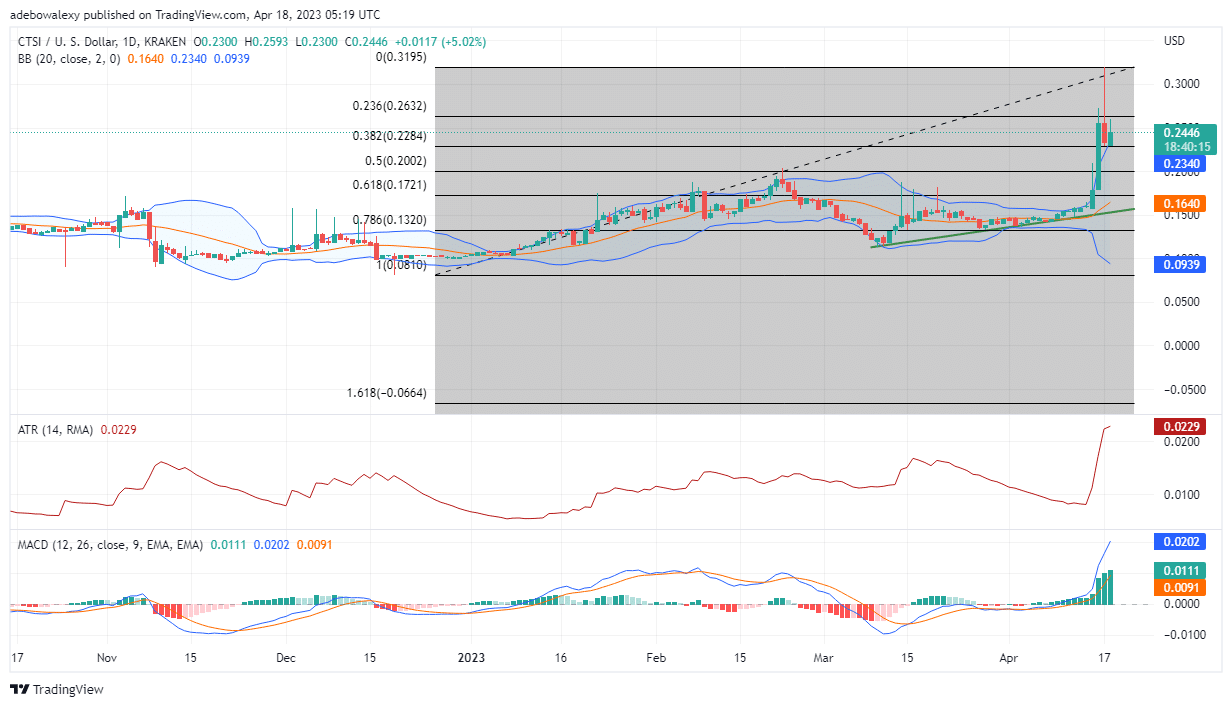
On the CTSIUSD daily market, the appearance of a green price candlestick has rekindled the hope of a price upside continuation in this market. Here, price action seems to have resumed its upward path, following a moderate downward retracement after it hit the highest limit of the Bollinger Bands indicator. Furthermore, the Average True Range indicator curve has indicated that price activity is trending upward. This can be observed through the terminal of this indicator, as it is pointed upwards. Also, the Moving Average Convergence Divergence (MACD) curves keep ramping upward above the equilibrium level at the 0.202 and 0.111 marks. Additionally, price action stays above the MA line of the Bollinger Bands indicator, and this points out that the ongoing trend may be rather strong.

Cartesi (CTSI) Price Action Remains Pursuant to the $0.2600 Price Level
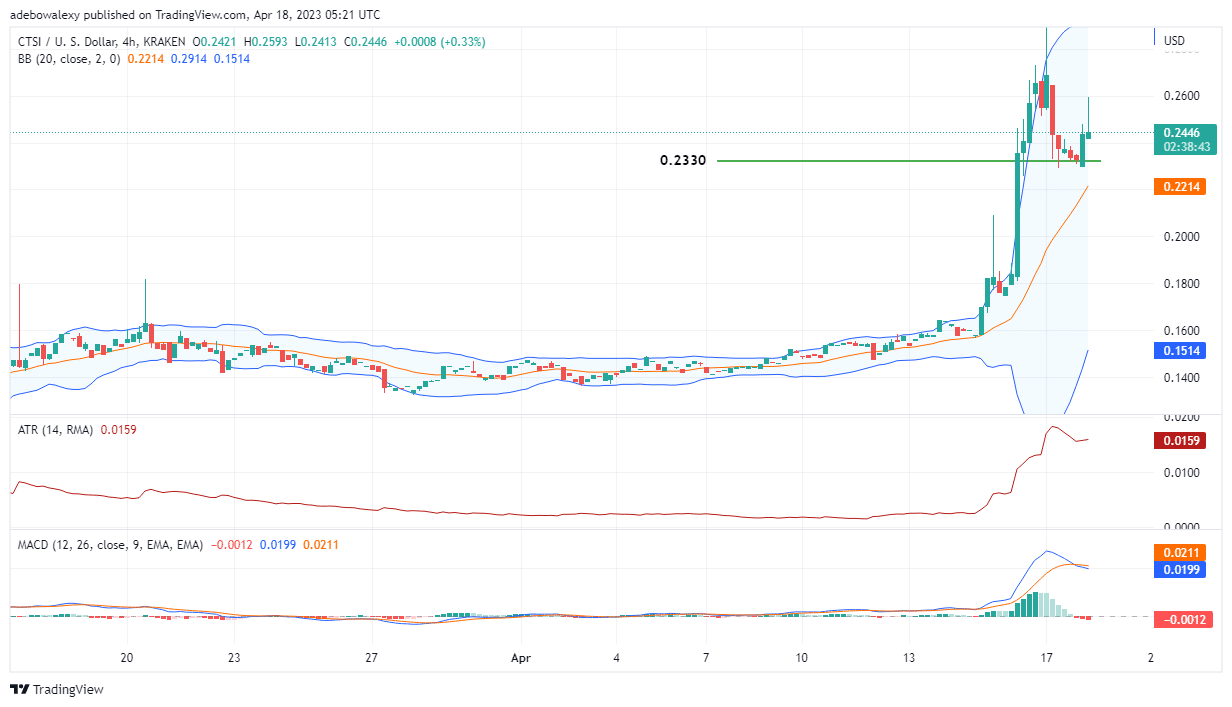
Price action on the 4-hour CTSIUSD market stays consistent with its pursuit of higher price marks. Another trading session has begun in favor of the buyer. This is happening after the price bounced off support at $0.2330. At the same time, the ATR indicator line is pointing upwards to suggest that bulls are in control at the moment. Nevertheless, the lines of the MACD have given a bearish crossover following the previous downward price retracement. However, traders should note that the lines aren’t really oriented towards the 0.00 mark; rather, these lines are now trending sideways with very little distance between them. The wick of the latest price candle here has already tested the $0.2600 mark precisely, while the Bollinger Bands indicator is tilted upwards. Consequently, this shows that the price is on track toward the $0.2600 mark.
- Broker
- Min Deposit
- Score
- Visit Broker
- Award-winning Cryptocurrency trading platform
- $100 minimum deposit,
- FCA & Cysec regulated
- 20% welcome bonus of upto $10,000
- Minimum deposit $100
- Verify your account before the bonus is credited
- Fund Moneta Markets account with a minimum of $250
- Opt in using the form to claim your 50% deposit bonus
Learn to Trade
Never Miss A Trade Again

Signal Notification
Real-time signal notifications whenever a signal is opened, closes or Updated

Get Alerts
Immediate alerts to your email and mobile phone.

Entry Price Levels
Entry price level for every signal Just choose one of our Top Brokers in the list above to get all this free.


