Buyers are increasing in Cardano market
ADA Price Analysis – 13 February
If buyers can maintain Cardano above the $0.54 resistance level, it might rise as high as $0.58 or $0.61 levels. The support levels at $0.48 and $0.46 will be looked at if the $0.51 barrier is broken.
Key Levels:
Resistance levels: $0.54, $0.58, $0.61
Support levels: $0.51, $0.48, $0.46
ADA/USD Long-term Trend: Bullish
Cardano’s daily chart indicates an upward trend. The price peaked at the $0.68 barrier on January 11. It quickly discovered a steady range of $0.54 to $0.58. When the previous high was retested, the chart displayed a double-top pattern. A clear bearish reversal pattern was seen at the $0.54 barrier level. Support and resistance levels were found between $0.51 and $0.48 as the market began to decline to the $0.46 mark. Right now, the price is moving back toward its prior high of $0.58.
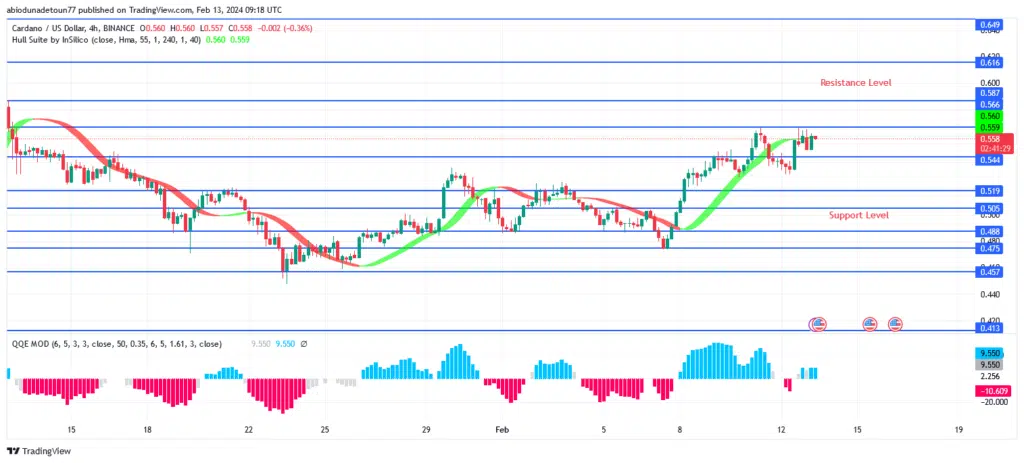
It appears that bulls are in control of the market because Cardano is trading above the Hull Suite indicator. If buyers can maintain the price above the $0.54 resistance level, it might rise as high as $0.58 or $0.61 levels. The support levels at $0.48 and $0.46 will be looked at if the $0.51 barrier is broken.
ADA/USD Medium-term Trend: Bullish
The 4-hour chart for Cardano shows an upward trend. For the past two weeks, it had attempted to breach the $0.59 resistance level on the 4-hour chart, but it had retreated. The trend continued to deteriorate, and ADA plummeted to $0.46 as the bears overcame the bulls. The cryptocurrency rallied with the formation of a bullish engulfing candle, buyers are holding onto the $0.51 level. Right now, the price is trying to break up the $0.54 resistance level.

The fact that Cardano’s price is currently trading above the Hull Suite signal indicates a favorable market. Considering that a buy signal is being indicated by the best forex signal QQE MOD indicator, which is currently above the zero line.
You can purchase Lucky Block here. Buy LBLOCK