ADA Price Analysis – March 23
In case the buyers gain more momentum and the daily candle close above $1.23 level, ADA/USD may increase to $1.46 which may later test $1.46 level. In case the buyers were unable to penetrate the $1.23 level, then, price may decrease towards the support level at $1.11, $0.98 and $0.83.
ADA/USD Market
Key Levels:
Resistance levels: $1.23, $1.46, $1.68
Support levels: $1.11, $0.98, $0.83
ADA/USD Long-term Trend: Bearish
ADA/USD is bearish on the daily chart outlook. The price continue decreasing as the bears’ momentum keep on increasing. When the coin reached the high of $1.46 on February 27, the bulls’ pressure could not break up the level as it holds price. The bullish momentum became weak. The bears took over the market at the same level with the formation of bearish engulfing candle. Today, the coin is exhibiting a price retracement towards $1.23 resistance level.
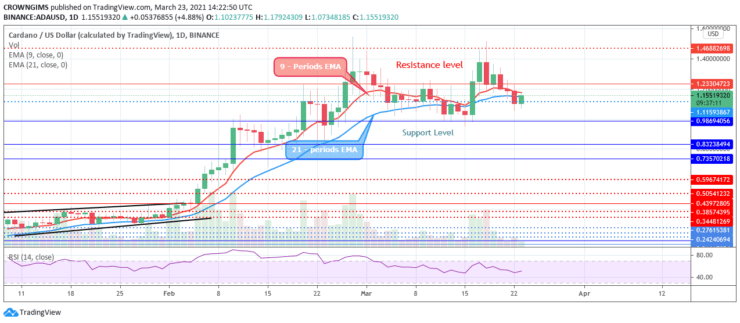
The crypto is trading between the 9 periods EMA and 21 periods EMA at moment as a sign of price retracement. The relative strength index period 14 is bending up at 40 levels to indicate buy signal. In case the buyers gain more momentum and the daily candle close above $1.23 level, ADA/USD may increase to $1.46 which may later test $1.46 level. In case the buyers were unable to penetrate the $1.23 level, then, price may decrease towards the support level at $1.11, $0.98 and $0.83.
ADA/USD Medium-term Trend: Bearish
Cardano is bearish on 4-hour chart. The Crypto tested the resistance level at $1.46 on March 18. The first time it tested the level was February 27. The mentioned level repeated the previous strong resistance capability by preventing ADAUSD penetrating the level. The coin started declining towards $1.11 price level.
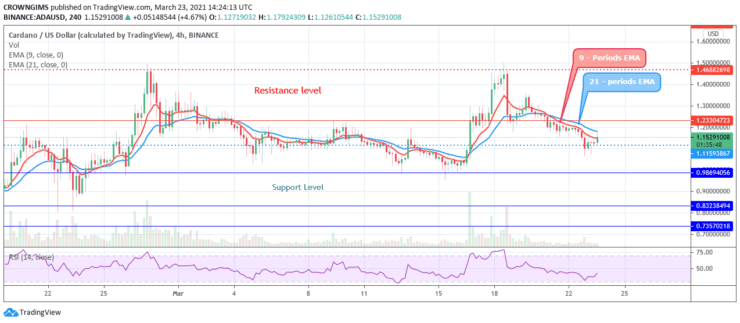
The two EMAs are distance away from each other which indicate that bearish momentum is increasing. The price is trading below the 9 periods EMA and 21 periods EMA as a sign of bearish movement. However, the relative strength index period 14 is above 30 levels and the signal line bending towards north as a bullish signal.
- Broker
- Min Deposit
- Score
- Visit Broker

- Award-winning Cryptocurrency trading platform
- $100 minimum deposit,
- FCA & Cysec regulated

- 20% welcome bonus of upto $10,000
- Minimum deposit $100
- Verify your account before the bonus is credited
- Fund Moneta Markets account with a minimum of $250
- Opt in using the form to claim your 50% deposit bonus
Learn to Trade
Never Miss A Trade Again

Signal Notification
Real-time signal notifications whenever a signal is opened, closes or Updated

Get Alerts
Immediate alerts to your email and mobile phone.

Entry Price Levels
Entry price level for every signal Just choose one of our Top Brokers in the list above to get all this free.