Binance Coin (BNB) price action is showing more bullish characteristics. Consequently, this has positioned the crypto for more possible price moves in the upside direction. However, the crypto market is a speculative one, and prices don’t always move unidirectionally. Consequently, let’s further examine the price action here.
Binance Coin Analysis Data:
BNB value now: $326
BNB Protocol Market Cap: $52.07 billion
Binance CoinMoving Supply: 157.9 million
Binance Coin Supply: 157.9
BNB CoinMarketCap ranking: 4
Major Price Levels:
Top: $326, $330, and $340
Base: $216, $306, and $296
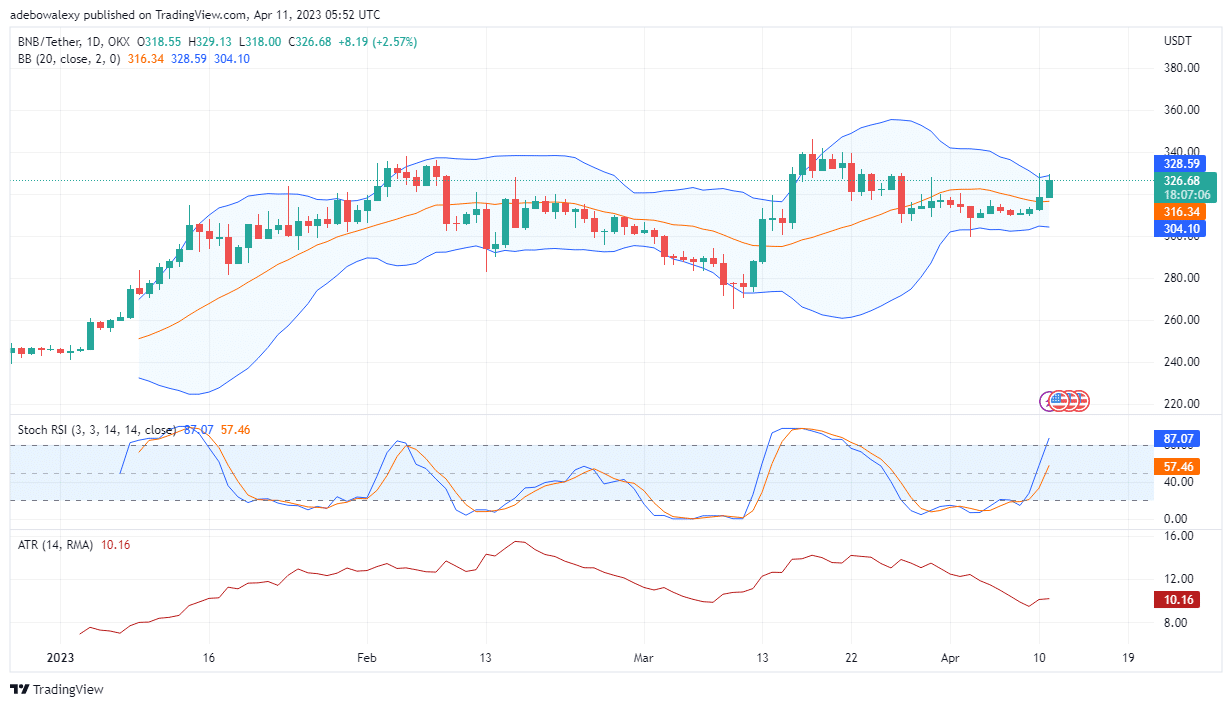
Binance Coin (BNB) Steadily Builds an Upside Momentum
Tailwind gradually piled up on the daily BNBUSDT market. It could be seen that the green price candle started growing in size four trading sessions ago. In the ongoing session, a much bigger price candle has appeared above the middle band of the used Bollinger Bands indicator. Also, the Relative Strength Index (RSI) indicator keeps running undisturbed in the overbought region. At the same time, the Average True Range (ATR) indicator curve is slightly oriented upward, which suggests that price activity is trending upward in this market.
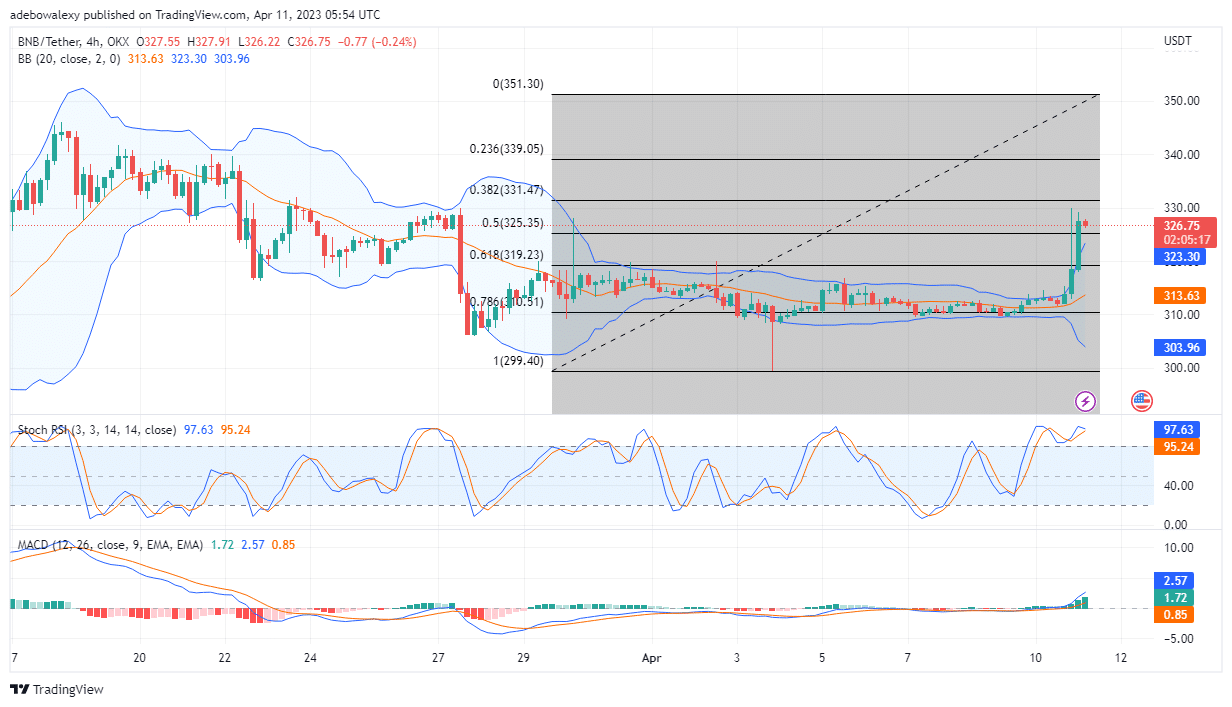
BNB Price Action Retraces Minimally After an Upside Rally
Coming to the 4-hour market for the BNBUSDT, one will see that the applied Bollinger Bands have been stretched exceedingly. And now, the current price level after the minimal downward retracement stays above the uppermost limit of the Bollinger Bands indicator. By implication, the observed downward retracement still aligns with the rule of the indicator, and price action still looks safe. Furthermore, the RSI lines, on the other hand, seem to be approaching a bearish crossover. Meanwhile, the MACD indicator curves keep trending upward above the equilibrium level. Also, the bars of the MACD indicator are still solid green and are getting taller. Consequently, the majority of signs from the 4-hour market still support the possibility of an additional price increase toward the $330 mark.
- Broker
- Min Deposit
- Score
- Visit Broker

- Award-winning Cryptocurrency trading platform
- $100 minimum deposit,
- FCA & Cysec regulated

- 20% welcome bonus of upto $10,000
- Minimum deposit $100
- Verify your account before the bonus is credited
- Fund Moneta Markets account with a minimum of $250
- Opt in using the form to claim your 50% deposit bonus
Learn to Trade
Never Miss A Trade Again

Signal Notification
Real-time signal notifications whenever a signal is opened, closes or Updated

Get Alerts
Immediate alerts to your email and mobile phone.

Entry Price Levels
Entry price level for every signal Just choose one of our Top Brokers in the list above to get all this free.