Don’t invest unless you’re prepared to lose all the money you invest. This is a high-risk investment and you are unlikely to be protected if something goes wrong. Take 2 minutes to learn more
Bubblemaps (BMTUSD) Price Forecast: June 20
The BMTUSD emerging bullish pattern signals a rally to the $0.160 mark as the bulls continue to gain strength and the crypto market remains strong above the supply trend levels. However, the momentum may continue if buyers exert more force on the price action and close the candle above the $0.150 barrier. Its anticipated price might reach the $0.160 resistance threshold, resulting in an intraday gain and a potential buy signal for coin holders.
Key Levels:
Resistance Levels: $0.149, $0.150, $0.151
Support Levels: $0.082, $0.081, $0.080
BMT (USD) Long-term Trend: Bullish (4H Chart)
The BMTUSD pair is bullish on the higher time frame. The bullish pattern signals a rally to the $0.160 level as it approaches the overhead resistance, reflecting promising growth. .160 Level" width="1281" height="497" data-lazy-src="https://learn2.trade/wp-content/uploads/2025/06/BMT-FRI-LNT.png"/>
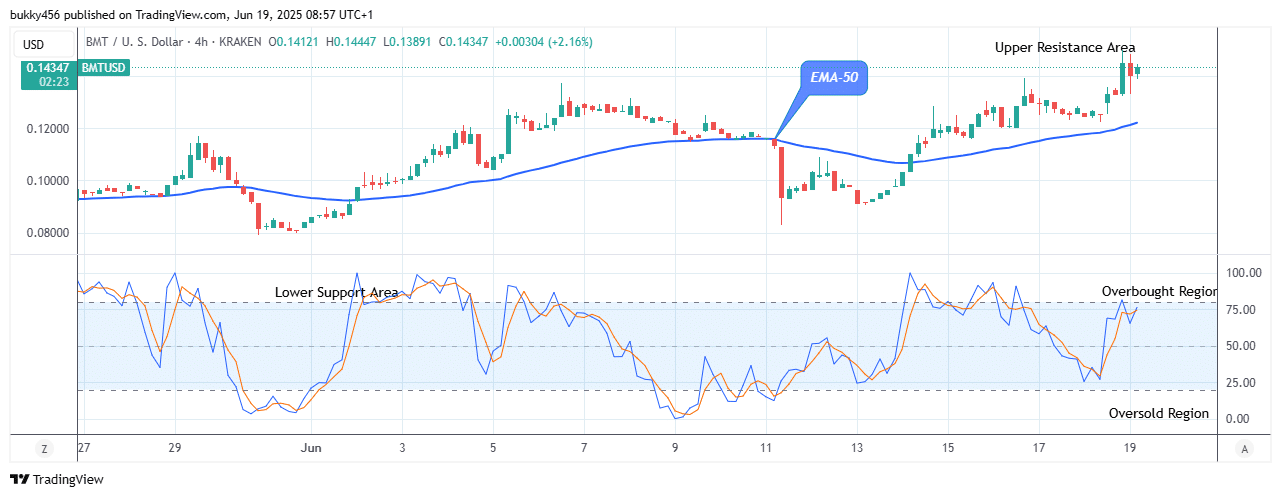
Today, after updating the low of $0.132, the Bubblemaps market appears promising as the bullish pattern signals a rally to $0.144 pullback above the resistance levels amid soaring network activity.
Hence, there is a tendency for the coin to rise further if the support level holds, this will enable buyers to take the coin price to a high of $0.150 previous mark, obtaining higher footing for the potential.
Notably, the BMTUSD market is pointing up on the daily stochastic, indicating that the crypto is open for bullish growth.
In light of this, the token price may surge to the $0.160 supply trend mark, as the bullish pattern signals a rally towards the upper resistance levels, registering a buy signal for coin traders in its long-term forecast.
BMT (USD) Medium-term Trend: Bullish (1H Chart)
Despite the moves by the short traders, the BMTUSD bullish pattern signals a rally to the $0.160 level and remains in an uptrend in its medium-term outlook. The price currently trades above the EMA line, confirming its bullishness..160 Level" width="1281" height="497" data-lazy-src="https://learn2.trade/wp-content/uploads/2025/06/BMT-FRI-MDT.png"/>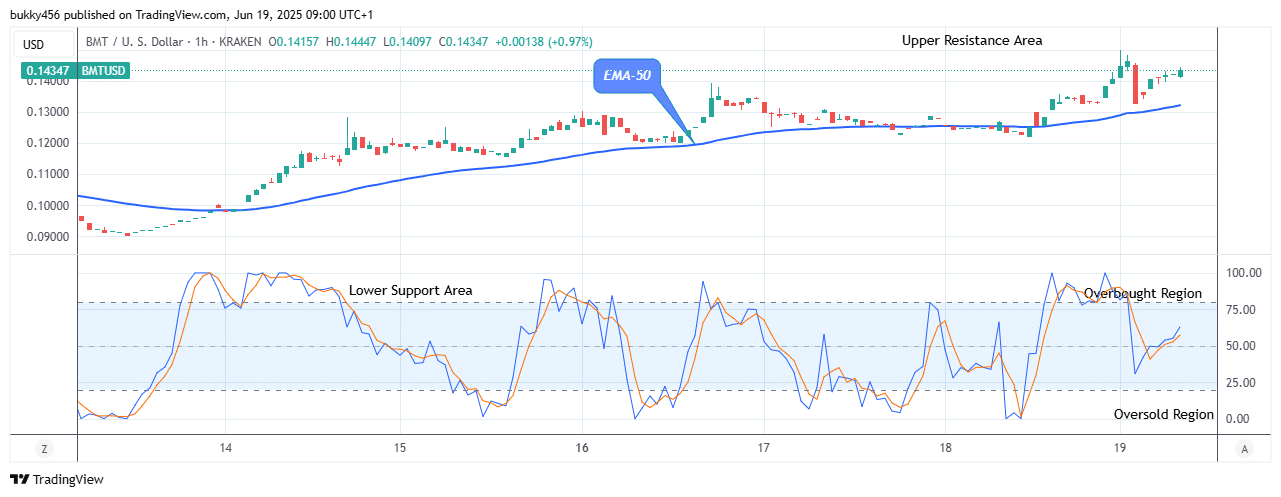
The market price of Bubblemaps at the $0.144 high level above the moving averages shortly after the 1-hour chart opens today, indicates that buyers are having the market price at their disposal at the present.
Additionally, if the coin price can sustain above the pattern supply trend line to revisit the previous high of $0.150, the potential recovery could assist buyers to drive the coin price to reach the $0.160 upper high level, indicating a 40% growth as the bullish pattern continues to rally up in its medium-term view. Thus, a buying time for coin traders.
Buy Bubblemaps on eightcap.com
- Broker
- Min Deposit
- Score
- Visit Broker

- Award-winning Cryptocurrency trading platform
- $100 minimum deposit,
- FCA & Cysec regulated

- 20% welcome bonus of upto $10,000
- Minimum deposit $100
- Verify your account before the bonus is credited
- Fund Moneta Markets account with a minimum of $250
- Opt in using the form to claim your 50% deposit bonus
Learn to Trade
Never Miss A Trade Again

Signal Notification
Real-time signal notifications whenever a signal is opened, closes or Updated

Get Alerts
Immediate alerts to your email and mobile phone.

Entry Price Levels
Entry price level for every signal Just choose one of our Top Brokers in the list above to get all this free.