Bitcon SV Price Analysis – August 25
In case the $217 level does not hold the price, it will increase further to test $237 and $259. Should the $217 price level holds, the bearish trend may continue, and support levels to look after are; $198, $185, and $179.
BSV/USD Market
Key Levels:
Resistance levels: $217, $237, $259
Support levels: $198, $185, $179
BSV/USD Long-term Trend: Bearish
In the Long-term, Bitcoin SV is bearish. The bears took over the market on August 18 at $217 price level when the bulls’ momentum was exhausted. Sellers exerted pressure on the coin and the price fall. The barrier at $217 and $198 level was penetrated, the price eventually bottomed at $185 support level. A double hammer daily candle pattern formed at $185 level indicates a bullish reversal. Strong bullish candle emerges on August 24 and the price increases towards the resistance at $217.
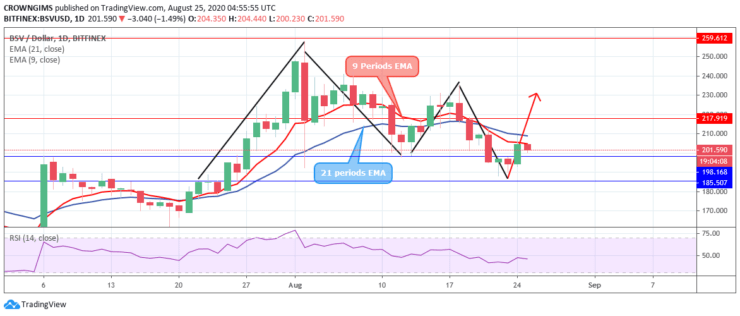
The coin is currently carrying out a price retest towards the broken level at $198. After the retest, the price may likely increase to the resistance level at $217. In case the $217 level does not hold the price, it will increase further to test $237 and $259. Should the $217 price level holds, the bearish trend may continue, and support levels to look after are; $198, $185, and $179. The price is trading below the 9 periods EMA and 21 periods EMA coupled with the RSI indicator bending towards south indicate sell which may be a pullback.
BSV/USD Medium-term Trend: Bullish
Bitcoin SV is bullish in short- term outlook. The bearish pressure break down the $198 price level and $185 level is tested. The price bounces and breaks up $198 level, facing the resistance level at $217. Price retest is ongoing towards $198 support level.
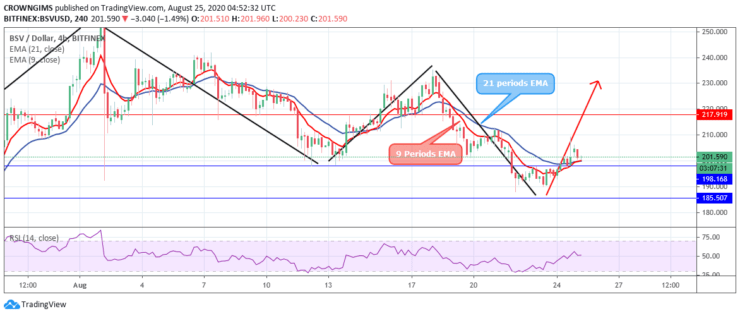
The price is already crossed above the 9 periods EMA and 21 periods EMA and the relative strength index period 14 is at 50 levels pointing towards north indicates a buy signal. BSV is targeting $217 resistance level.
- Broker
- Min Deposit
- Score
- Visit Broker

- Award-winning Cryptocurrency trading platform
- $100 minimum deposit,
- FCA & Cysec regulated

- 20% welcome bonus of upto $10,000
- Minimum deposit $100
- Verify your account before the bonus is credited
- Fund Moneta Markets account with a minimum of $250
- Opt in using the form to claim your 50% deposit bonus
Learn to Trade
Never Miss A Trade Again

Signal Notification
Real-time signal notifications whenever a signal is opened, closes or Updated

Get Alerts
Immediate alerts to your email and mobile phone.

Entry Price Levels
Entry price level for every signal Just choose one of our Top Brokers in the list above to get all this free.