BNBUSD market ranges between $254.2 and $236.9 levels
BNBUSD Price Analysis 11 August
The $254.2 resistance level can be broken higher, challenging the $276.5 and $286.4 resistance levels, if buyers can hold the $236.9 support level. BNB may drop to its most recent lows of $219.1 and $209.0 levels before closing below the crucial $236.9 level if sellers maintain their momentum.
BNB/USD Market
Key levels:
Supply levels: $254.2, $276.5, $286.4
Demand levels: $236.9, $219.1, $209.0
BNBUSD Long-term Trend: Ranging
The daily chart for BNBUSD exhibits a range of movement. The price movement continues within the range of $254.2 and $236.9 levels, due to low volatility in the BNB market. The price movement of the BNB has resulted in the formation of a double-bottom chart pattern. A bullish reversal chart pattern began to form at the $219.1 support level. When BNB tested the previously mentioned level twice on June 12 and June 28, a bullish trend began. Buyers entered as soon as the bulls increased their pressure, but the bears were blocking the movement. The cost ranges from $254.2 to $236.
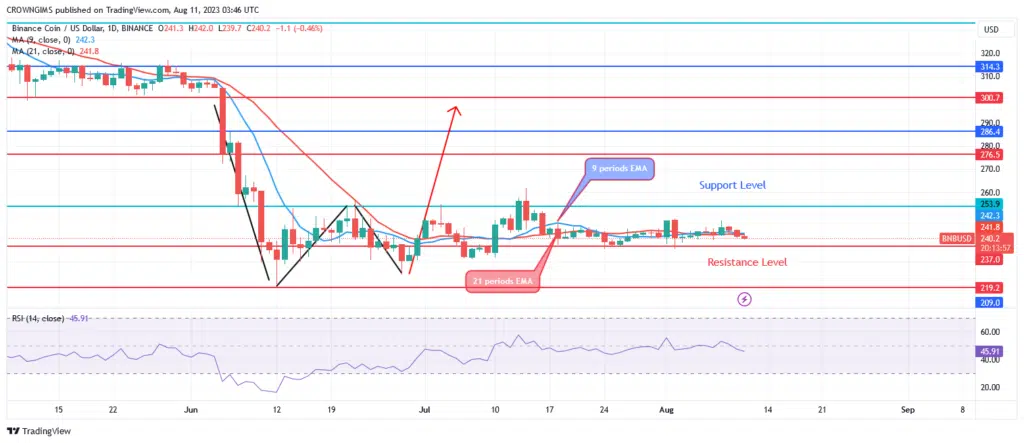
A range movement was seen when the 9-period and 21-period exponential moving averages interlocked. The BNB price wants to perform better than the two EMAs. The $254.2 resistance level can be broken higher, challenging the $276.5 and $286.4 resistance levels, if buyers can hold the $236.9 support level. BNB may drop to its most recent lows of $219.1 and $209.0 levels before closing below the crucial $236.9 level if sellers maintain their momentum.
BNBUSD medium-term Trend: Ranging
Ranging movement continues in a 4-hour time frame. At a price of $219.1 on June 12, the double bottom chart pattern initially appeared, signaling that buyers will probably take control of the market. The buyers’ enthusiasm decreased after the forced price test at the $254.2 barrier level. Price movement began to oscillate in a consolidation pattern between $254.2 and $236.9 in that range.
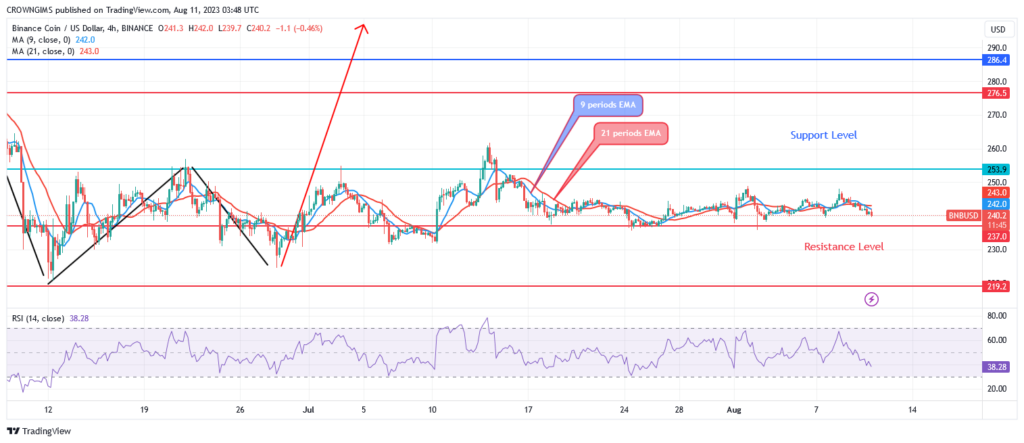
BNB is currently trading in a range as it trades near the 9- and 21-period exponential moving averages. A sell is implied when the relative strength index period 14 signal line is moving downward at level 38.
You can purchase Lucky Block – Guide, Tips & Insights | Learn 2 Trade here. Buy LBLOCK
- Broker
- Min Deposit
- Score
- Visit Broker

- Award-winning Cryptocurrency trading platform
- $100 minimum deposit,
- FCA & Cysec regulated

- 20% welcome bonus of upto $10,000
- Minimum deposit $100
- Verify your account before the bonus is credited
- Fund Moneta Markets account with a minimum of $250
- Opt in using the form to claim your 50% deposit bonus
Learn to Trade
Never Miss A Trade Again

Signal Notification
Real-time signal notifications whenever a signal is opened, closes or Updated

Get Alerts
Immediate alerts to your email and mobile phone.

Entry Price Levels
Entry price level for every signal Just choose one of our Top Brokers in the list above to get all this free.