Ranging movement in BNBUSD market
BNBUSD Price Analysis 21 July
In case buyers can sustain the $253.8 support level, the $276.5 resistance level can be broken higher, testing the $286.4 and $300.7 resistance levels. If sellers get more momentum before closing below the critical $253.8 barrier, BNB may decline to its most recent lows of $240.2 and $219.5.
BNB/USD Market
Key levels:
Supply levels: $276.5, $286.4, $300.7
Demand levels: $253.8, $240.2, $219.5
BNBUSD Long-term Trend: Ranging
BNBUSD’s daily chart shows a ranging movement. A double-bottom chart pattern has been created as a result of the BNB’s price movement. At the $219.5 support level, a bullish reversal chart pattern was formed. A bullish trend started when BNB tested the previously indicated level twice on June 12 and June 28. As soon as the bulls begin to exert additional pressure, buyers enter. However, the price has been ranging between $276.5 and $253.8 levels.
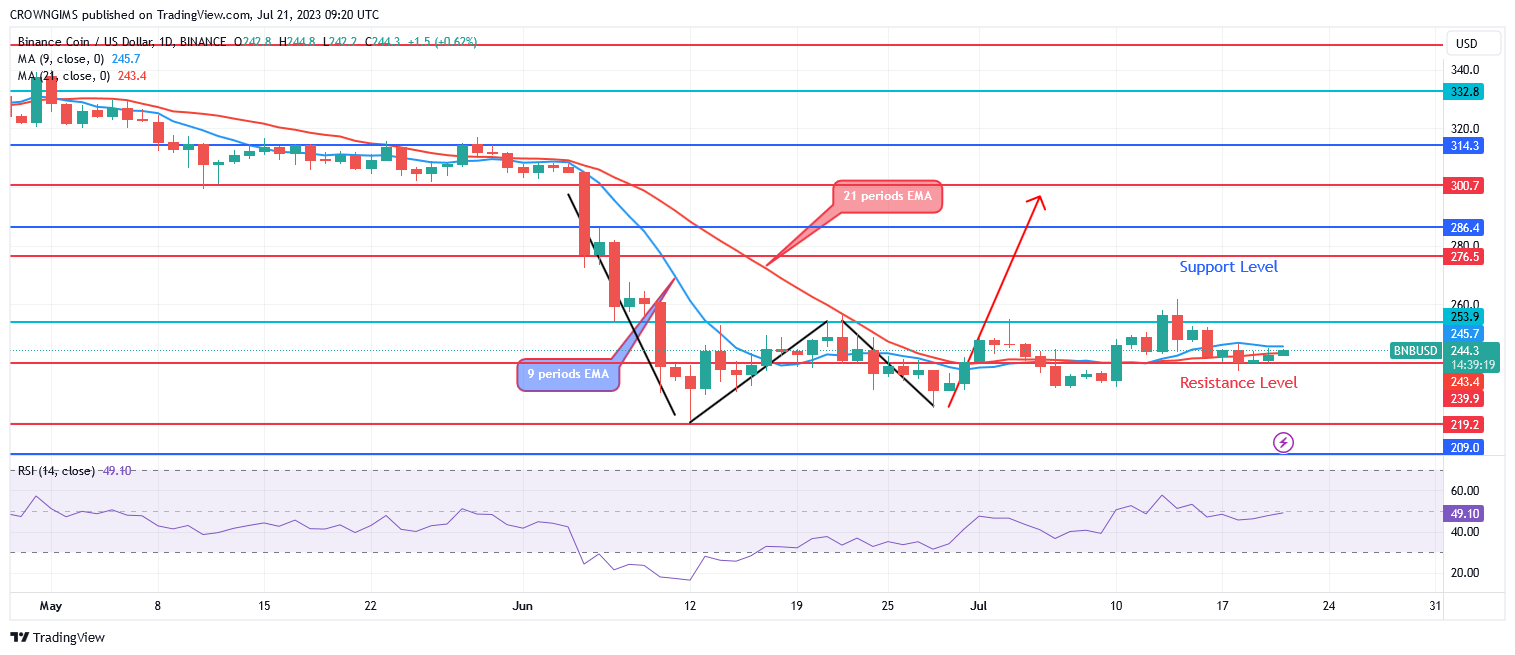
When the 9-period EMA interlocked the 21-period EMA, it represents a ranging movement. The BNB price is attempting to perform better than the two EMAs. In case buyers can sustain the $253.8 support level, the $276.5 resistance level can be broken higher, testing the $286.4 and $300.7 resistance levels. If sellers get more momentum before closing below the critical $253.8 barrier, BNB may decline to its most recent lows of $240.2 and $219.5.
BNBUSD medium-term Trend: Bullish
The price of BNB is increasing on the four-hour chart. The double bottom chart pattern first occurred on June 12 at a price of $219.5, indicating that buyers are likely to seize control of the market. After the forced price test at the $253.8 barrier level, the sellers’ enthusiasm waned. Price started a consolidation movement within $276.5 and $253.8 levels.
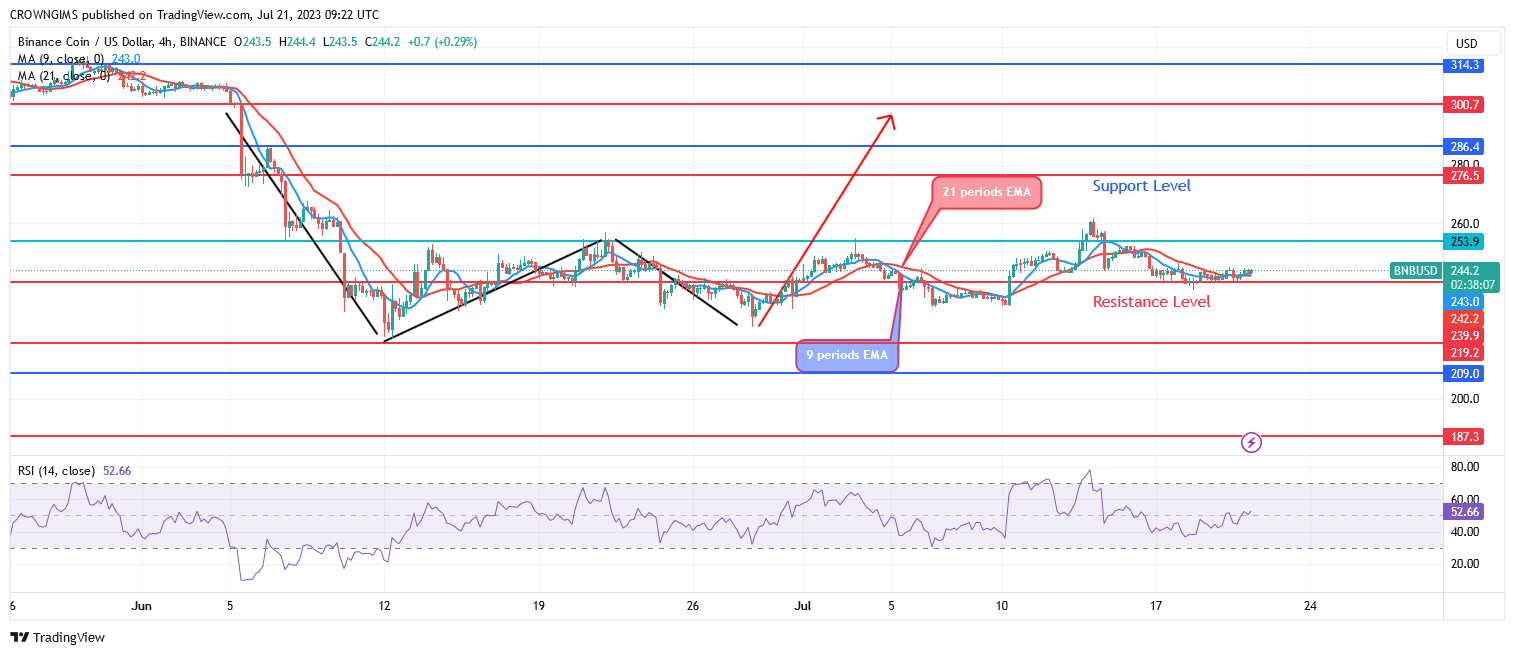
BNB is currently trading around the 9- and 21-period exponential moving averages, indicating a ranging market. When the relative strength index period 14 signal line at level 52 is pointing up, a buy is implied.
You can purchase Lucky Block – Guide, Tips & Insights | Learn 2 Trade here. Buy LBLOCK
- Broker
- Min Deposit
- Score
- Visit Broker

- Award-winning Cryptocurrency trading platform
- $100 minimum deposit,
- FCA & Cysec regulated

- 20% welcome bonus of upto $10,000
- Minimum deposit $100
- Verify your account before the bonus is credited
- Fund Moneta Markets account with a minimum of $250
- Opt in using the form to claim your 50% deposit bonus
Learn to Trade
Never Miss A Trade Again

Signal Notification
Real-time signal notifications whenever a signal is opened, closes or Updated

Get Alerts
Immediate alerts to your email and mobile phone.

Entry Price Levels
Entry price level for every signal Just choose one of our Top Brokers in the list above to get all this free.