

Bitcoin SV Price Analysis – June 13
An increase in the bears’ pressure will break down the support level of $47 in which the support levels of $35 and $30 may be tested. In case the resistance level of $58 is broken upside, the price may increase towards the resistance levels at $71, and $87.
Key Levels:
Resistance levels: $58, $71, $87
Support levels: $47 $35, $30
BSV/USD Long-term Trend: Bearish
On the daily chart, Bitcoin SV is bearish. The Crypto was on the ranging movement last week. The resistance level of $58 holds the price and the bulls’ pressure was equally weak. The support level of $47 was defended by the bulls and this scenario leads to the ranging movement within the resistance level of $58 and support level of $47 for more than two weeks ago. Today, bears gather enough momentum to break down the support level of $47 and the price exposes to the support level of $35.
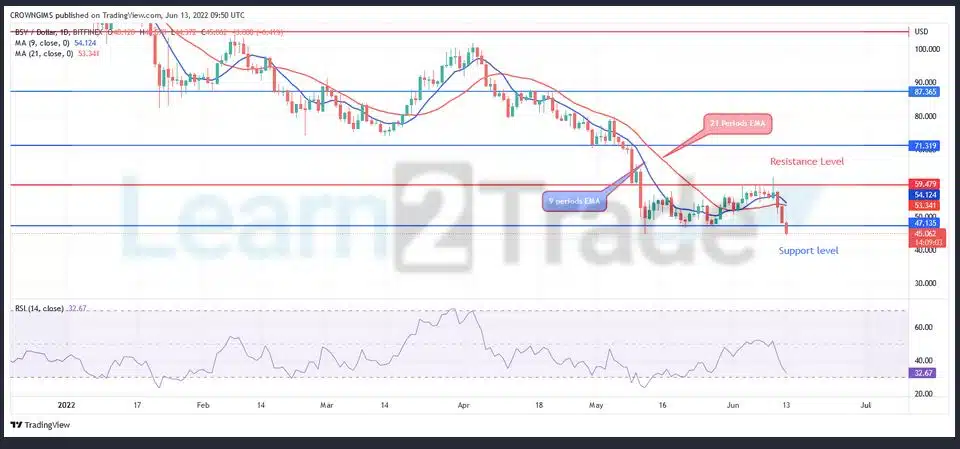
The two EMAs are bending down to follow the direction of the price. The crypto is trading below the 9 periods EMA and the 21 periods EMA which indicate bearish momentum. An increase in the bears’ pressure will break down the support level of $47 in which the support levels of $35 and $30 may be tested. In case the resistance level of $58 is broken upside, the price may increase towards the resistance levels at $71, and $87.
BSV/USD Medium-term Trend: Bearish
Bitcoin SV is on the bearish movement on the medium-term outlook. The bearish movement continues after ranging movement between the resistance level of $58 and support level of $47. Bears are dominating the Bitcoin SV market today and the price may reach the support level of $35.

The price is trading below the 9 periods EMA and 21 periods EMA which indicate that bears’ momentum is high. The relative strength index period 14 is at 25 levels displaying a bearish signal.
You can purchase Lucky Block here: Buy LBlock


