Bitcoin SV Price Analysis – February 17
When the resistance level of $259 holds, the price may change the direction towards the following support levels; $217, $179, and $153.
BSV/USD Market
Key Levels:
Resistance levels: $259, $311, $364
Support levels: $217, $179, $153
BSV/USD Long-term Trend: Bullish
The market of BSV/USD opened at $238.63 and closed at $236.85 yesterday; that means there was a decrease or loss of -0.75%. In other words, the bears maintain their position in the Bitcoin SV market. The price is moving gradually towards the support level of $217 with the formation of daily bearish candles. A further increase in the trading percentage is possible in case the dynamic support level prevents further decrease.
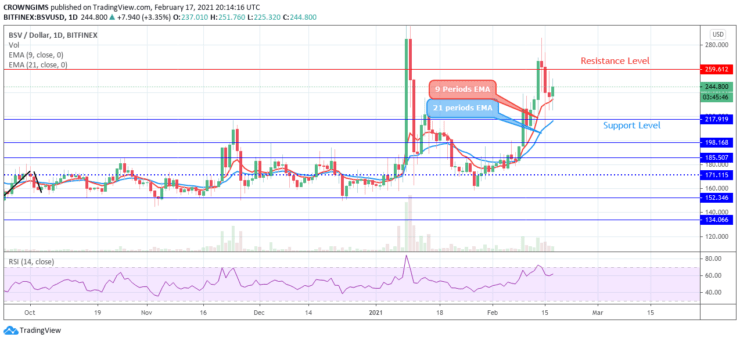
Today’s Bitcoin SV market opens with another daily bullish candle above the 9 periods EMA and 21 periods EMA indicates that it may experience an increased volume and more bullish pressure. BSV/USD is targeting the resistance level of $259 in which it may be penetrated in case the bulls increase their momentum. Another significant resistance level ahead can be found at $311 and $364. When the resistance level of $259 holds, the price may change the direction towards the following support levels; $217, $179, and $153. The Relative Strength Index period 14 indicator is making a more bullish movement which connotes an increase in price.
BSV/USD Medium-term Trend: bullish
On the medium-term outlook, Bitcoin SV is on the bullish trend. The crypto slowly increasing within a symmetrical triangle formed in the 4-hour chart. The coin is fluctuating above 9 periods EMA and 21 periods but at low volatility. This may continue until there is a radical fundamental occurrence in the crypto market that breaks out from triangle.
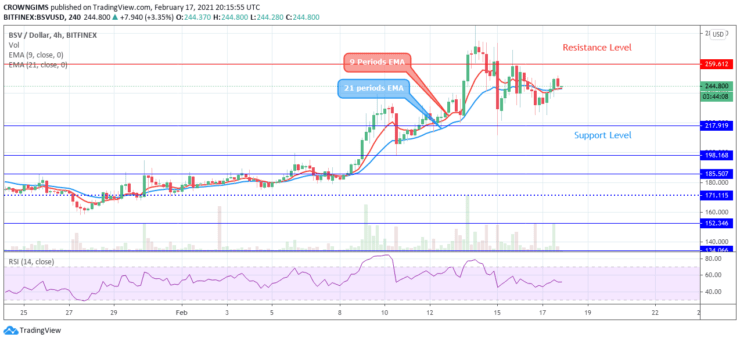
The relative strength index is displaying a bullish signal above the 50 levels which indicate that there could be a bullish breakout from the triangle formed.
- Broker
- Min Deposit
- Score
- Visit Broker

- Award-winning Cryptocurrency trading platform
- $100 minimum deposit,
- FCA & Cysec regulated

- 20% welcome bonus of upto $10,000
- Minimum deposit $100
- Verify your account before the bonus is credited
- Fund Moneta Markets account with a minimum of $250
- Opt in using the form to claim your 50% deposit bonus
Learn to Trade
Never Miss A Trade Again

Signal Notification
Real-time signal notifications whenever a signal is opened, closes or Updated

Get Alerts
Immediate alerts to your email and mobile phone.

Entry Price Levels
Entry price level for every signal Just choose one of our Top Brokers in the list above to get all this free.